Time-Based Data: Analyze with Slope Charts
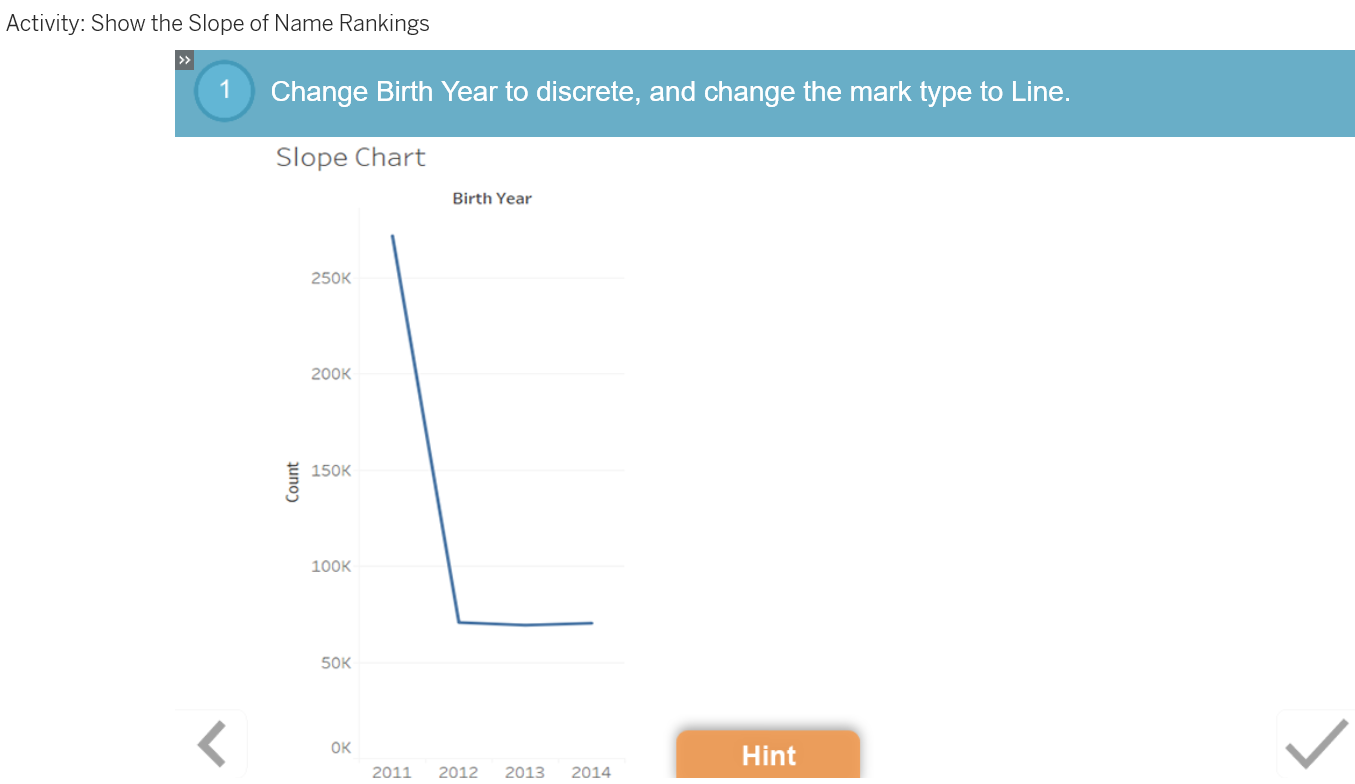
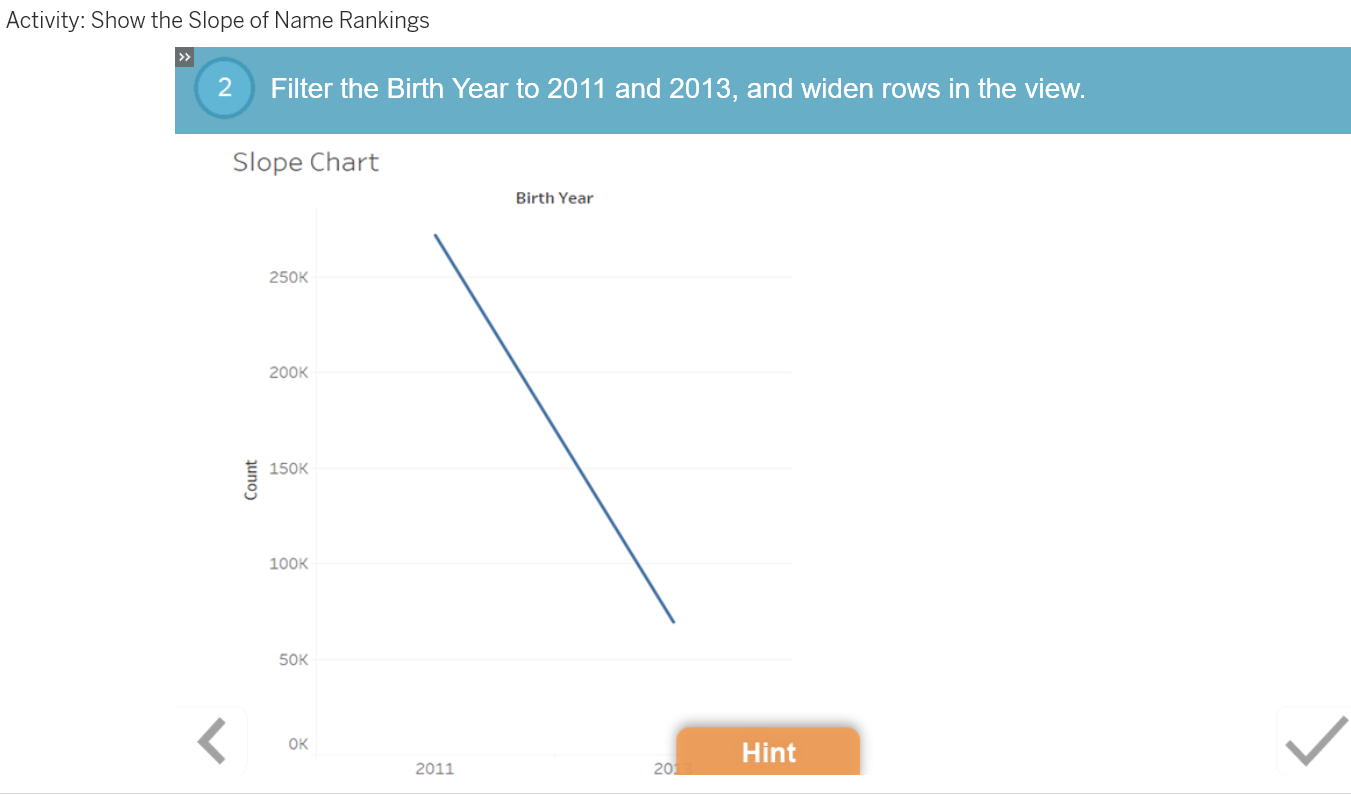
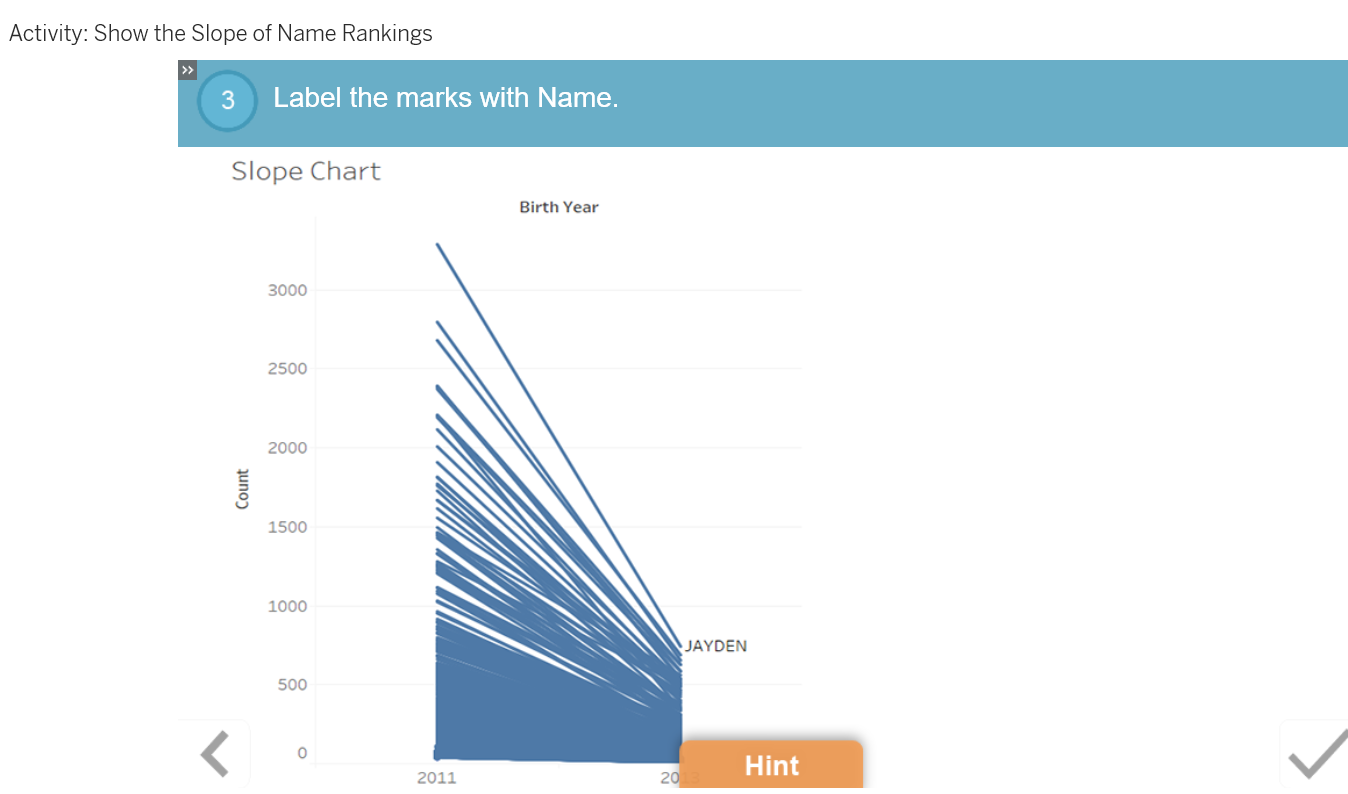
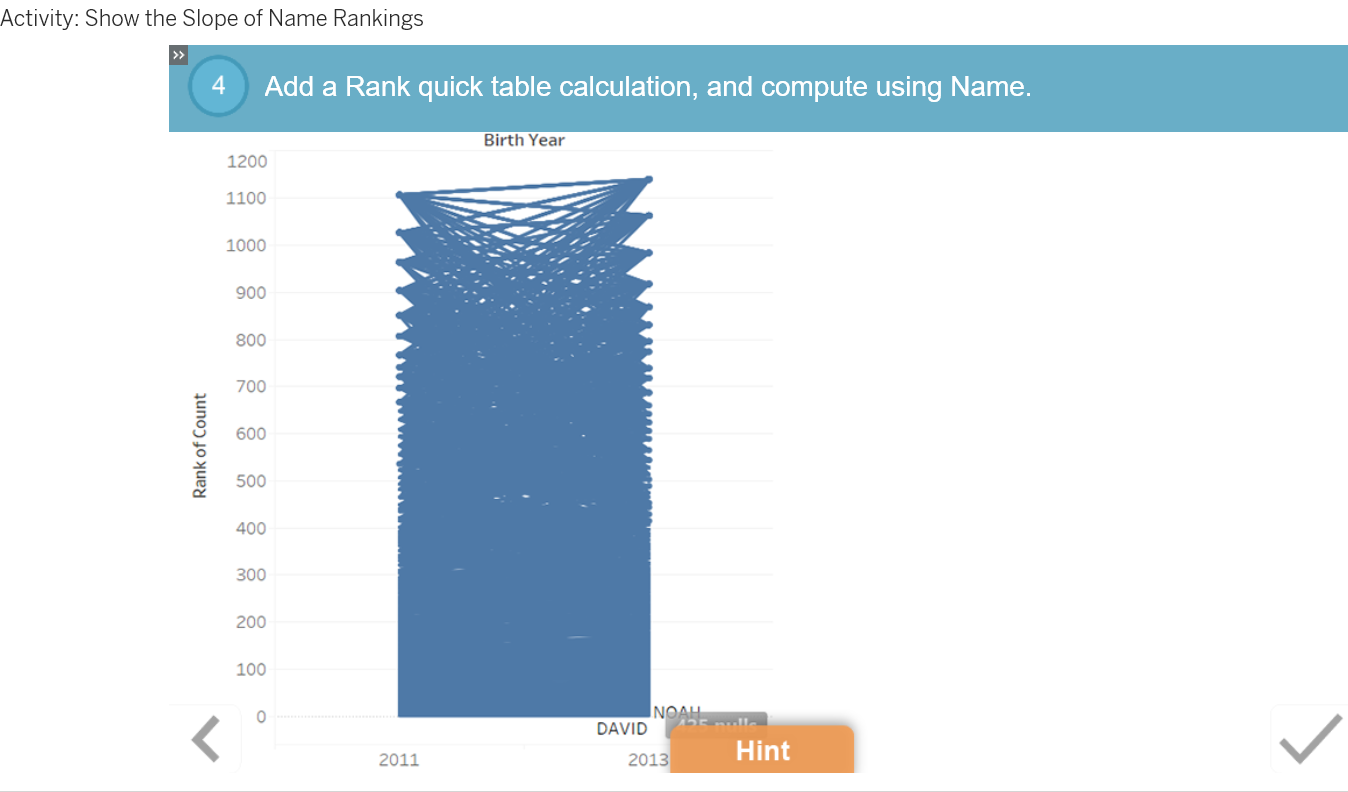
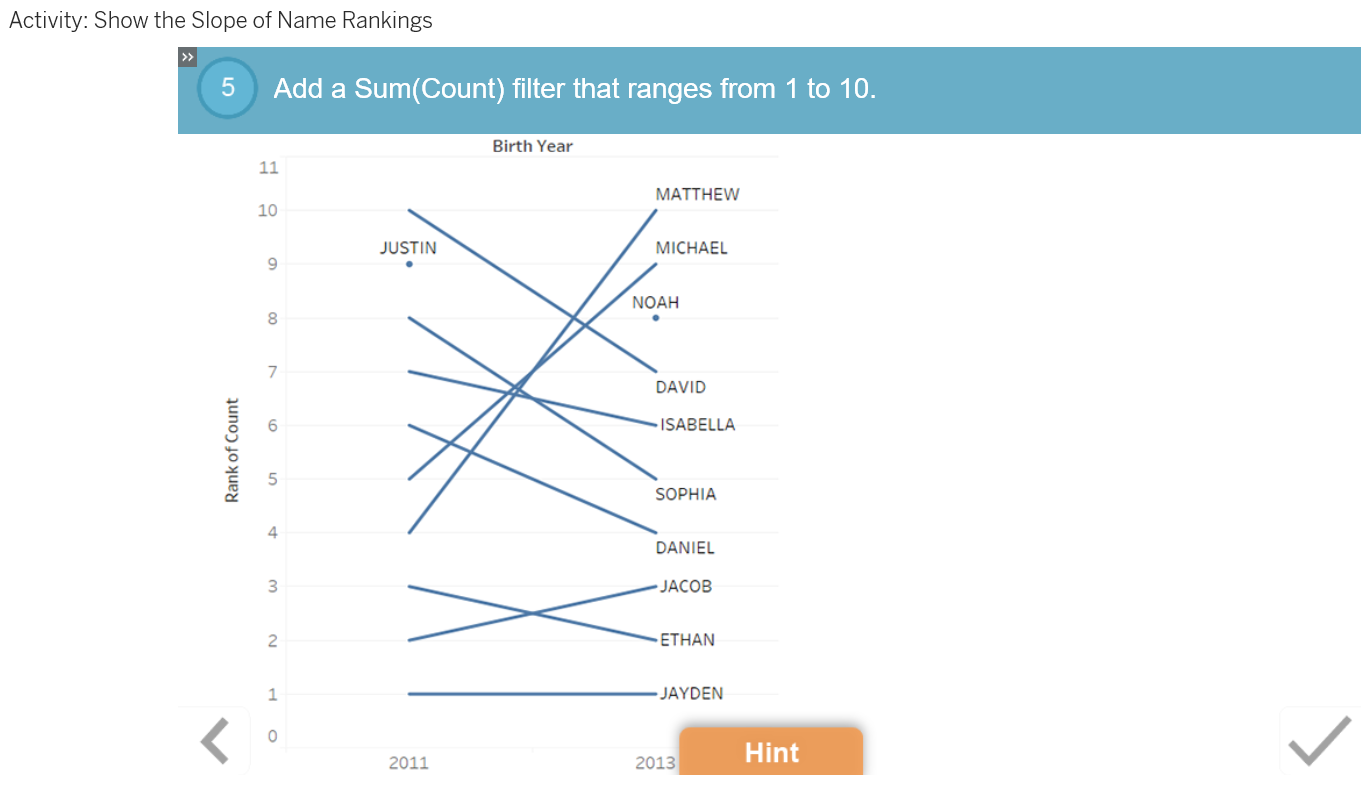
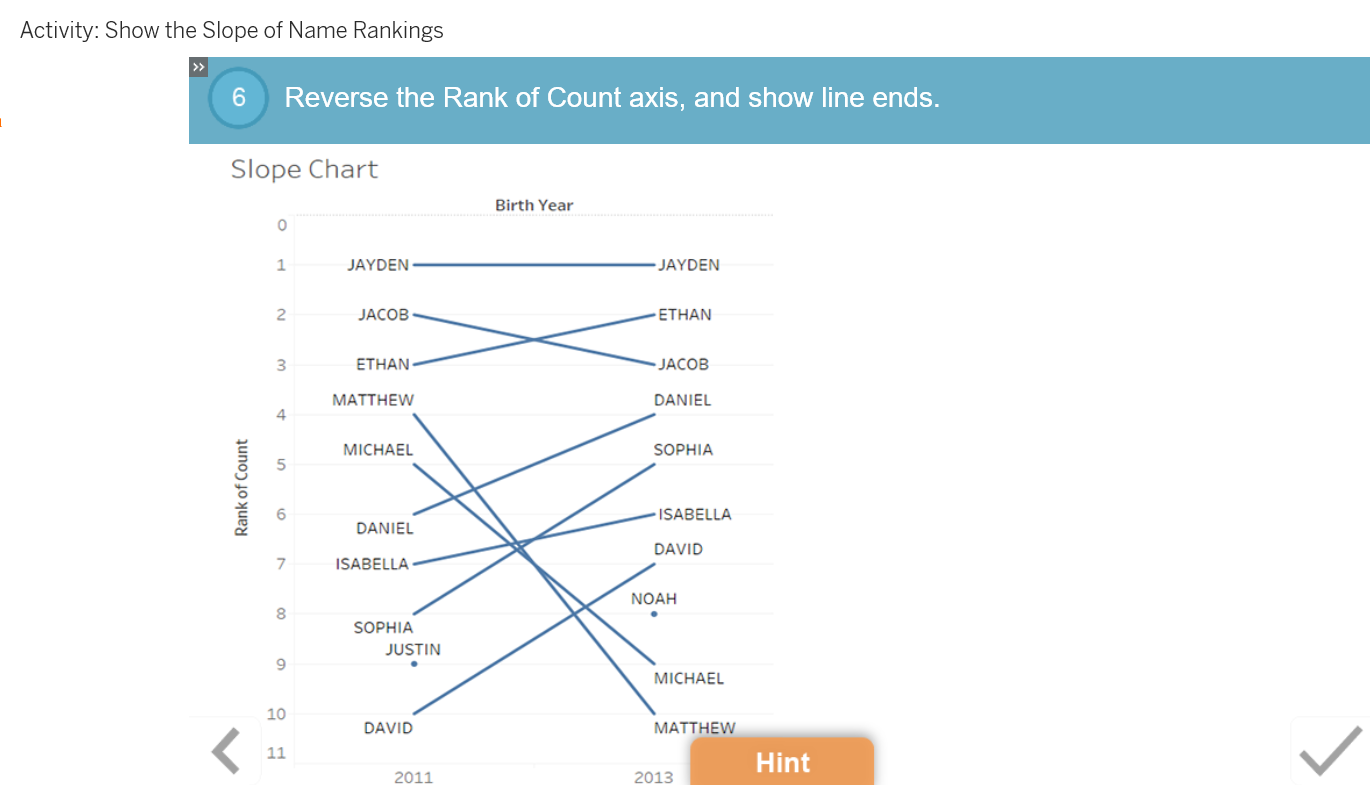
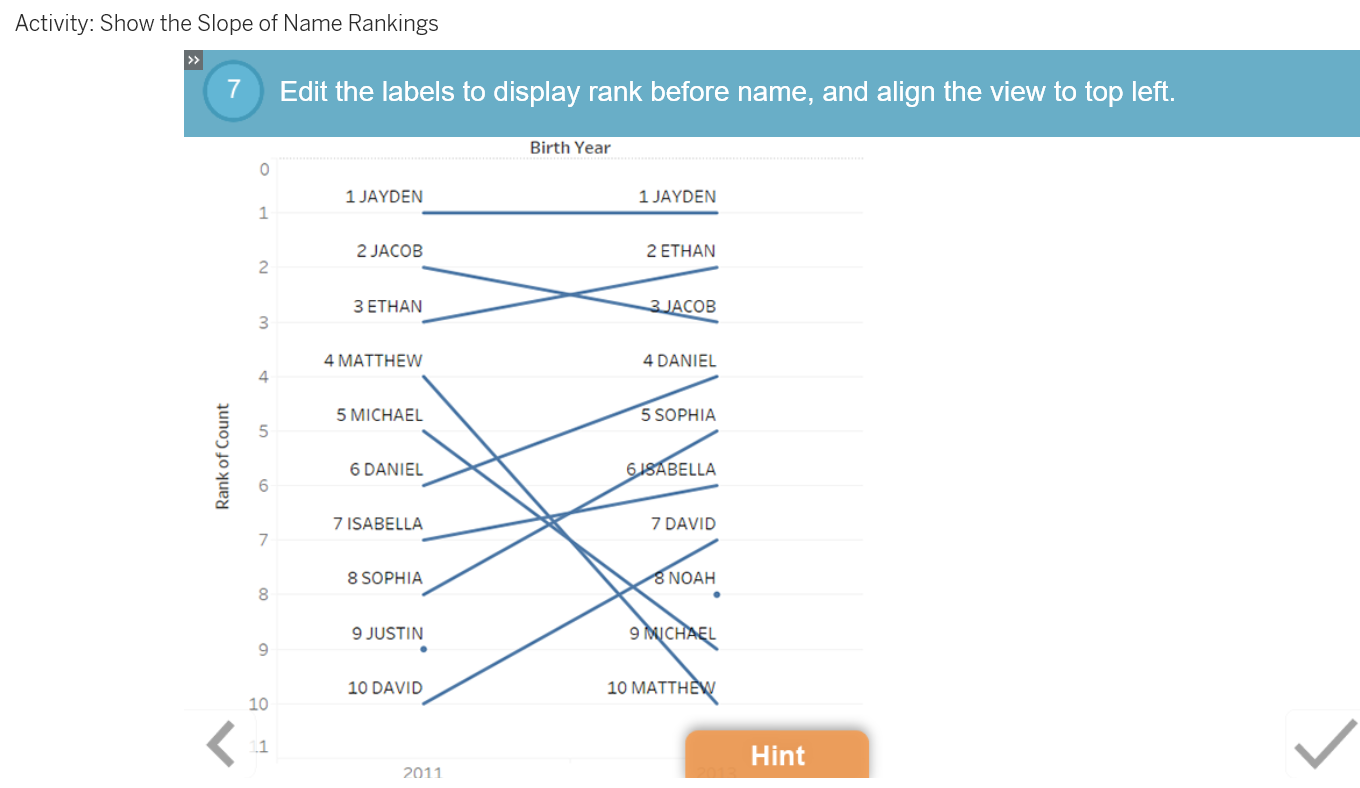
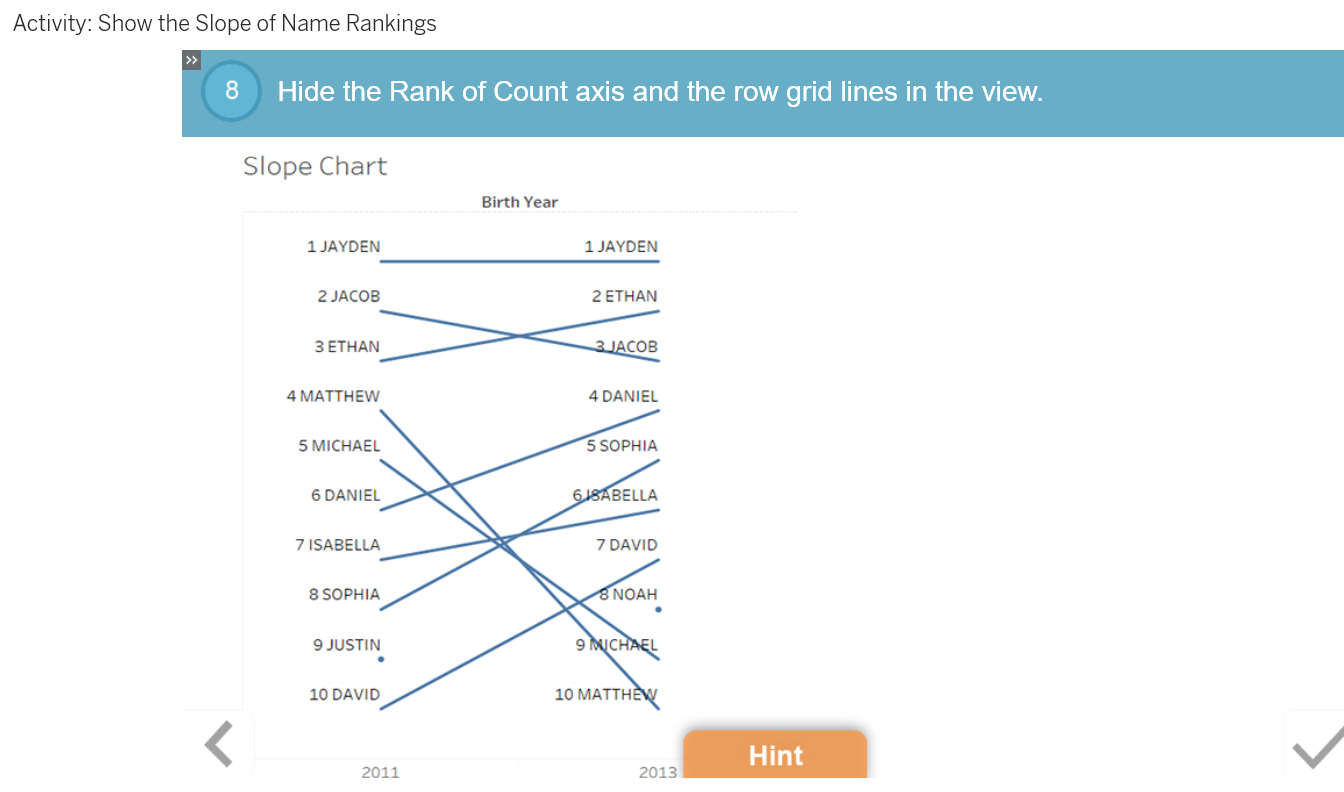
Use a slope chart to show how ranked data changes over time. A slope chart is a simplified presentation of time-based data that uses sloping lines to reveal how the data has changed. The up-or-down direction of the lines indicates that the data’s ranking has increased or decreased. The degree of slope shows the extent of change. Slope charts are both easy to interpret and easy to build.
Demo: Using a Slope Chart to Tell a Before and After Story
At the end of this lesson, you will be able to:
- Create a slope chart.
- Describe when to use a slope chart.
- Edit and format a slope chart.
- Create and edit a slope chart.
- Use a quick table calculation to rank dimensions in the view.
