Why Data Visualisations matter
Our brains are wired for fast visual processing. For our ancestors, this need for speed could tip the balance between life and death. The ability to quickly detect and decode subtle visual cues, like animal tracks or movements in the bushes, could make the difference between seeing dinner or being dinner. Although, many of the dangers our ancestors faced have receded, our ability to rapidly perceive patterns and detect subtle visual queues remains. The impulse to detect, match, and make sense of patterns is so strong that many of us do it not only for practical purposes but also as a form of pure-play in many games. The information "Lion=danger!" was more relevant than "21650 blades, 23 bees, 7 trees, and 1 predator seen". Elsewise we'd have been in danger of extinction.

However, the human brain is a powerful tool and is always processing multiple things all the time. In terms of visualization, it is our job to help lessen the cognitive load and decrease clutter, so that when the audience is looking at your visual, they can clearly process it. To define the terms of cognitive load and clutter is necessary to understand the concepts of all visualization designs. First off, let's talk about cognitive load. It seems like a pretty intuitive sounding term. The definition is it is the amount of mental effort that we use to get the information that we need.
For data visualization, we need to learn how to minimize the cognitive load while also communicating the message accurately. There are three types of cognitive load, intrinsic, extraneous, and germane. Intrinsic cognitive load is the amount of memory that we need to understand something. So if I'm adding 2 plus 2, I could do that while I'm distracted or even while I'm speaking to you right now. But if I have to do long division, there is no way I'm going to be able to present this material and do that long division at the same time. I'll need to concentrate and can't be distracted. Otherwise, it'll take a lot longer, or I won't be able to do it at all.
The next one is extraneous cognitive load. That is the amount of extra brainpower that I need to deal with poorly designed visualizations. It is the ability to not only visually spot the issues but be able to describe them, as well. It is how information is presented, and if it is ineffective, that puts extra pressure on our cognitive load. Finally, germane cognitive load is a way for the brain to look for patterns to develop context. As with extraneous load, it is to help take a cognitive issue and present it in an easy and meaningful way. We'll use these three types of cognitive loads instinctively throughout this specialization. Okay, with cognitive load defined, let's talk about clutter. As I'm talking here, I see a pile of papers on my desk. My desk is cluttered, I have to admit. This stuff is clutter, as we know in common parlance. So clutter is definitely one of those things that we know when we see it. For data visualization experts like you, it's about determining what needs to be in a visualization and doesn't need to be in the visualization to reduce the clutter.
So to take the desk analogy, most of these papers don't have to be on my desk. They can either be recycled or filed somewhere else. But they're still here, I need to remove those papers and thus reduce the clutter. So having defined both terms, we could see that cognitive load and clutter are fully intertwined. The reason we want to reduce clutter is so that we can minimize the cognitive load of the reader for data visualization.
Pre-attentive Attributes
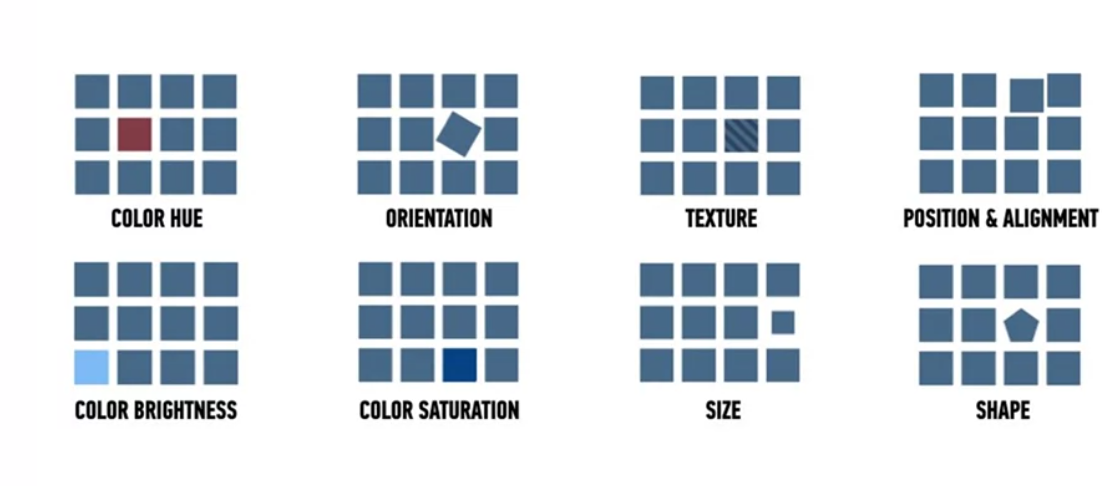
The whole point of doing visualizations is to enable the reader to see what we want them to see before they even know that they're looking for or that they've seen it. It's pretty amazing and awesome how the mind works, and we want to take advantage of that whenever we're doing visualizations. So if you want to draw the eyes of your audience, you can change the character of the element you want people to see. You can change the size, the color, orientation, shape, line, length, or width, you can put in an enclosure, intensity, or spatial position. All of those are preattentive attributes and more. Each of these have their uses, depending on what you're visualizing. For example, some preattentive attributes have an implicit quantitative element like a bar in a bar graph or a line in a line graph. Some, like shape or color, are used for categories. The key is to use them sparingly and strategically to draw the attention of the audience.

source: https://www.coursera.org/learn/data-visualization-tableau/home/welcome