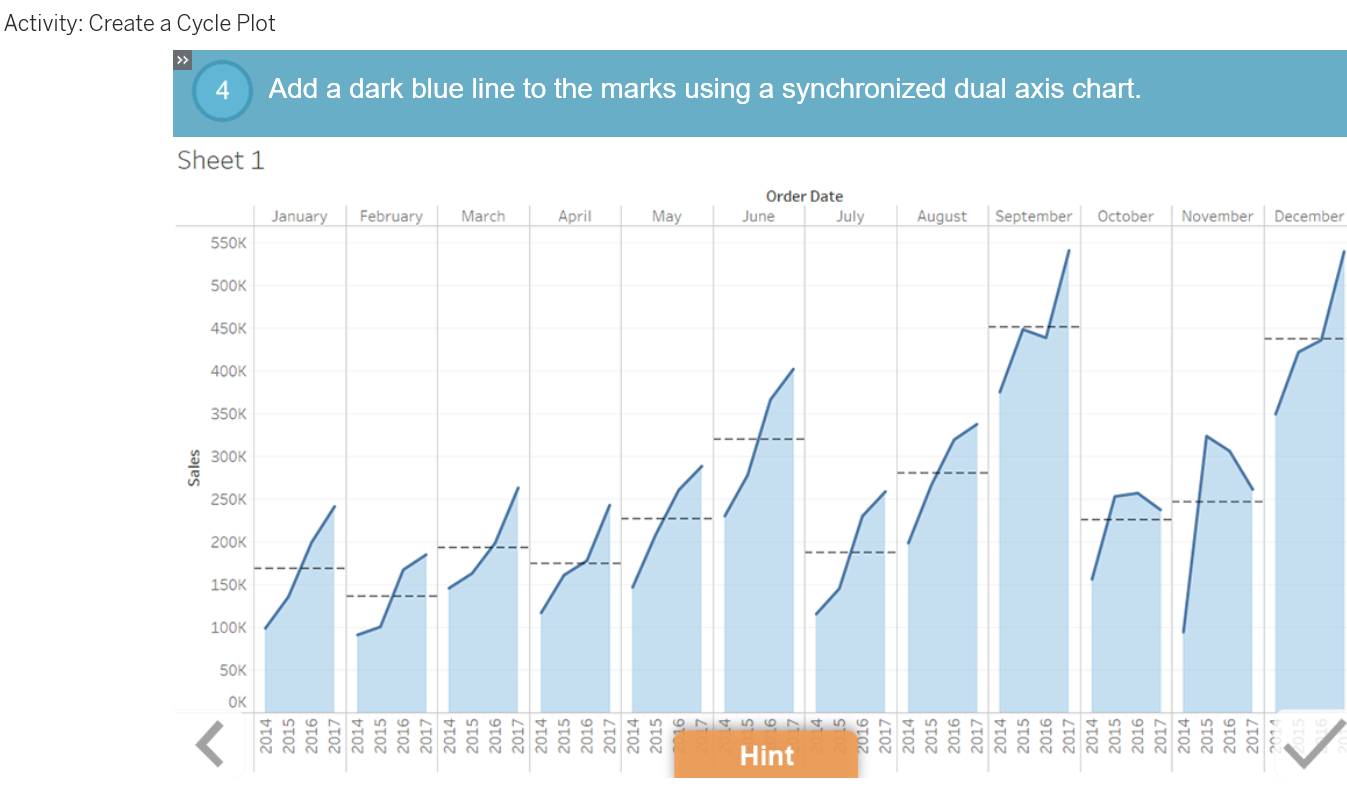
Seasonality: Show Trends with Cycle Plots
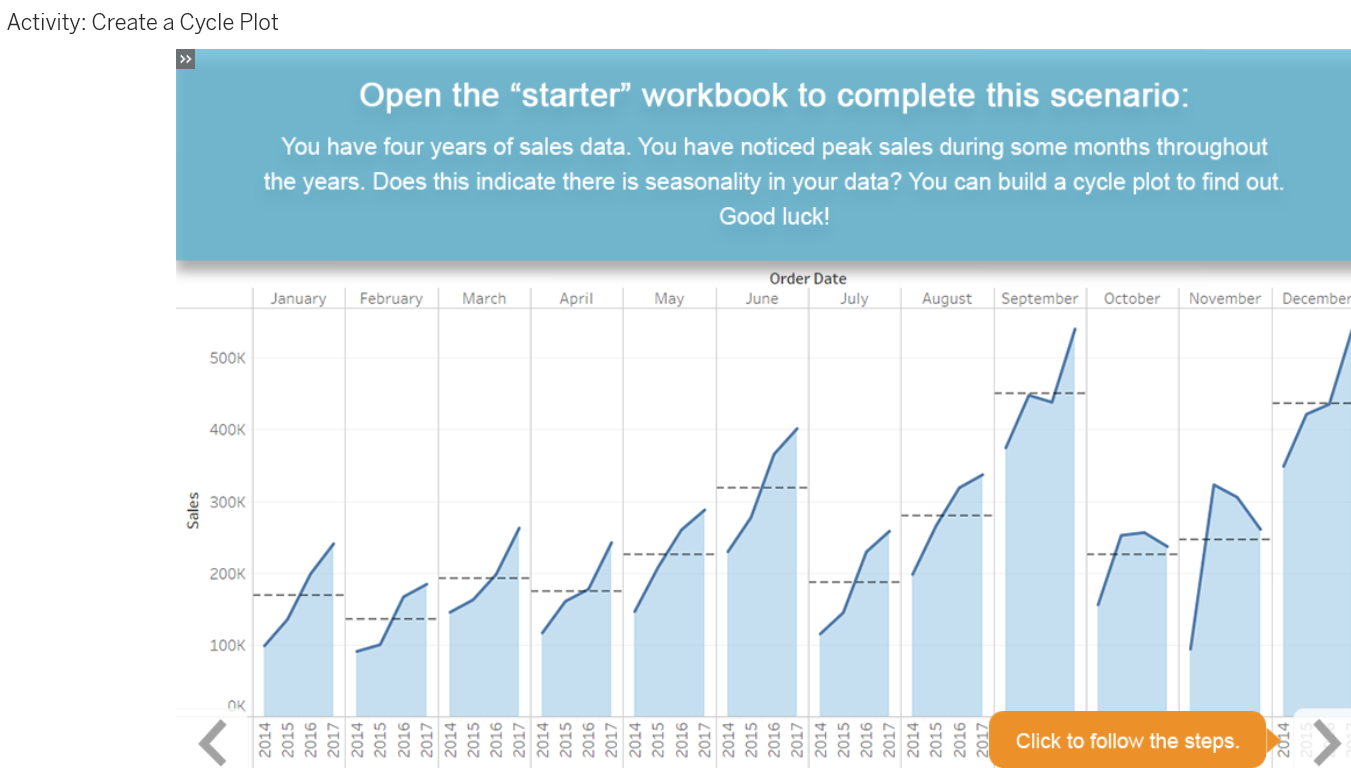
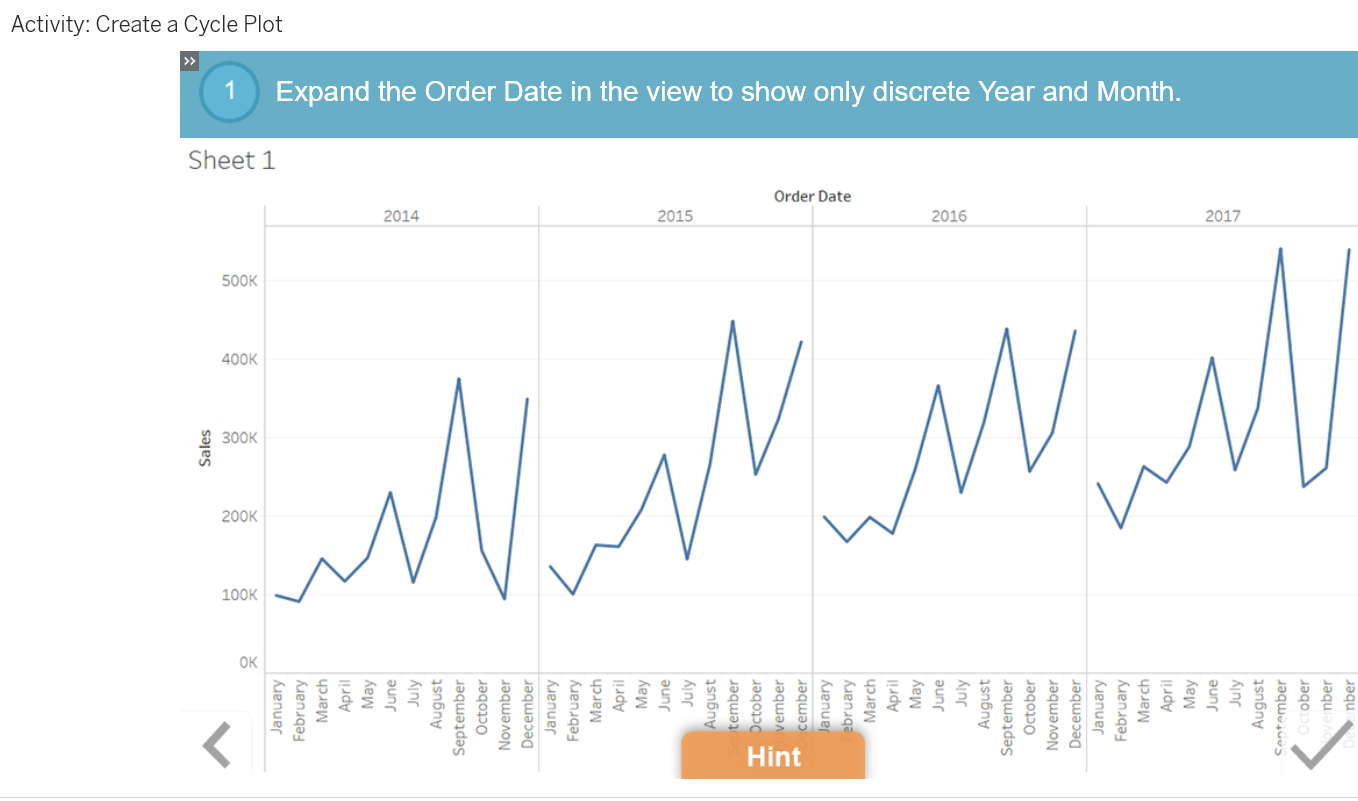
Seasonality refers to any predictable change in a time series that repeats over a one-year period. With data, we can look for seasonality and trends. But if we have a time series that only connects start and end points, trends may remain hidden. And what if we need to compare two trends?
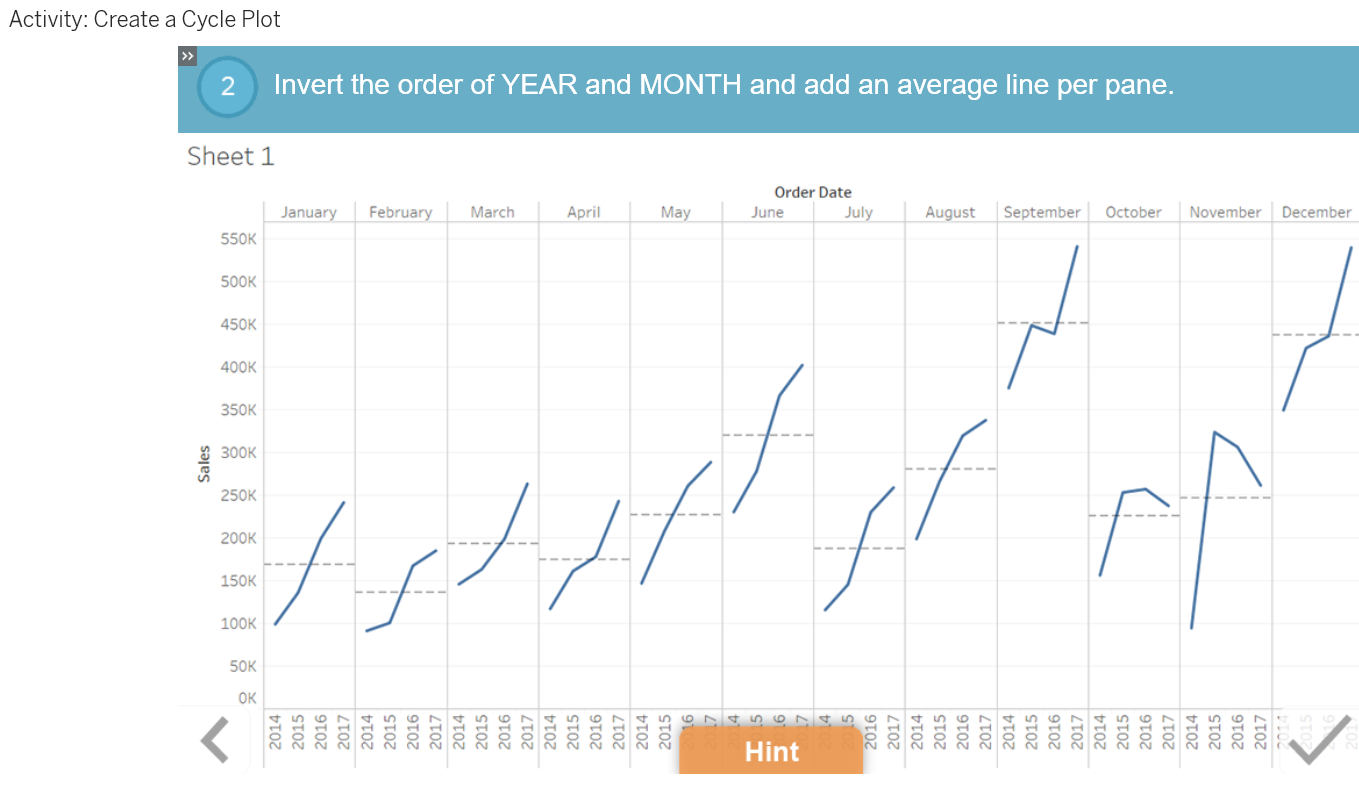
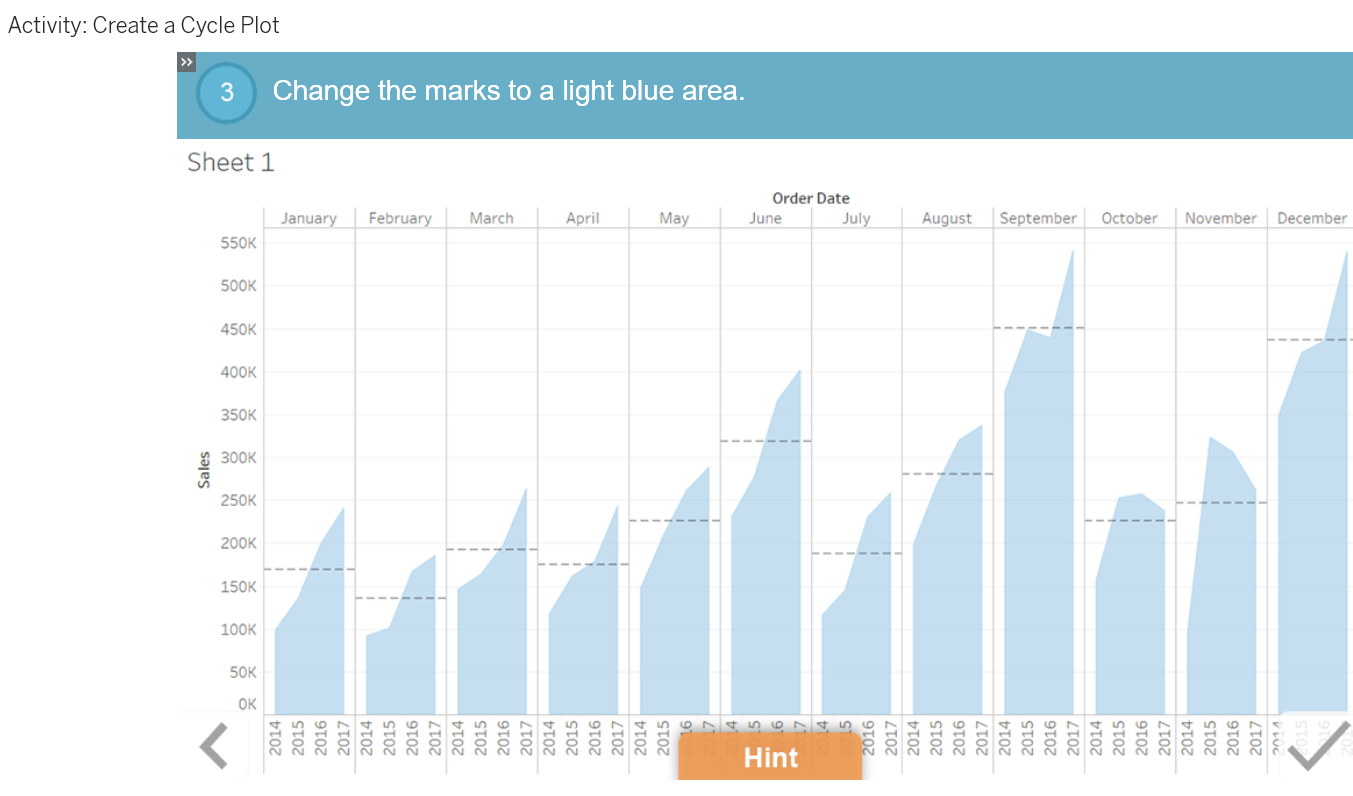
Cycle plots show the trends of two different time periods simultaneously. Because cycle plots show trends over the whole time period as well as shorter periods, you can present more information at once.
Lesson Objectives
At the end of this lesson, you will be able to:
- Recall the definition of seasonality.
- Recognize seasonality in time series data.
- Build and format a cycle plot.
