Time-Based Data: Analyze with Control Charts
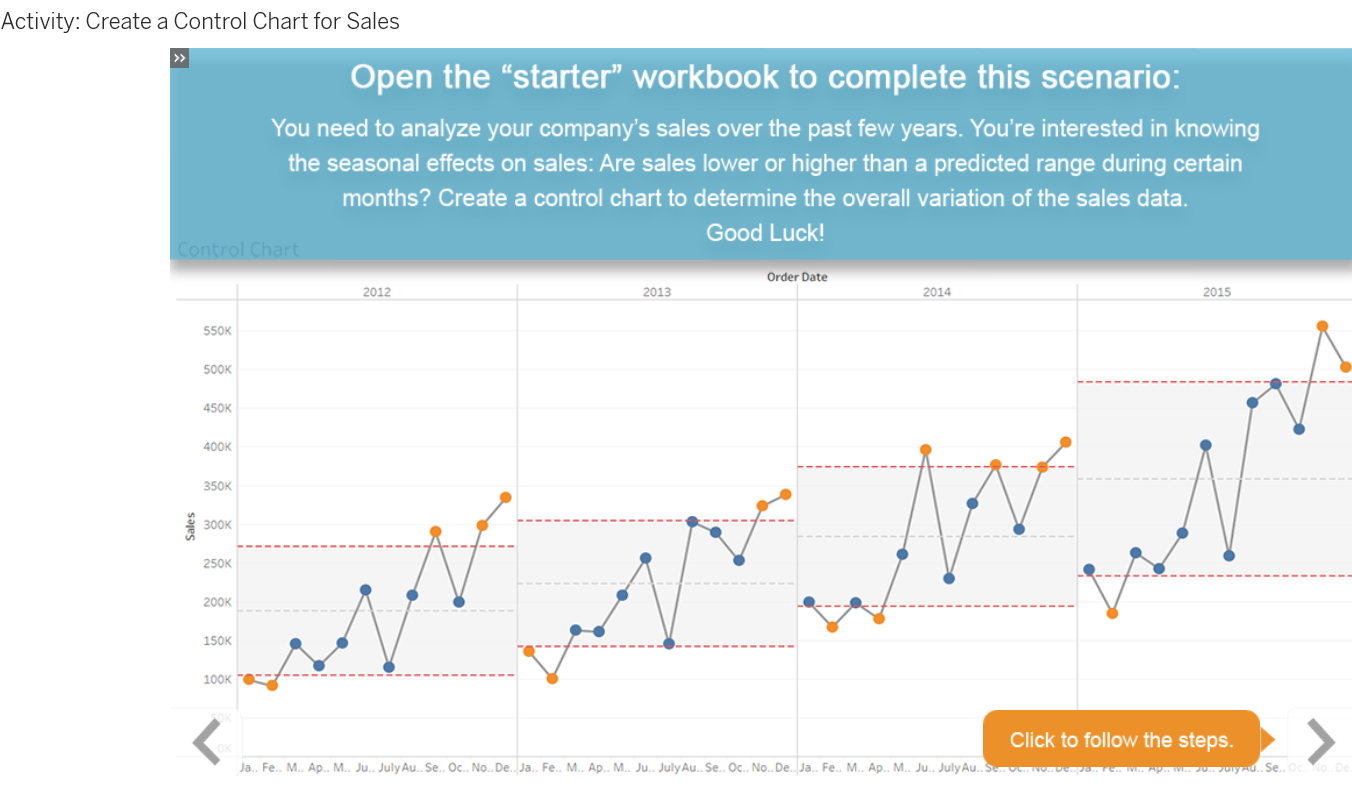
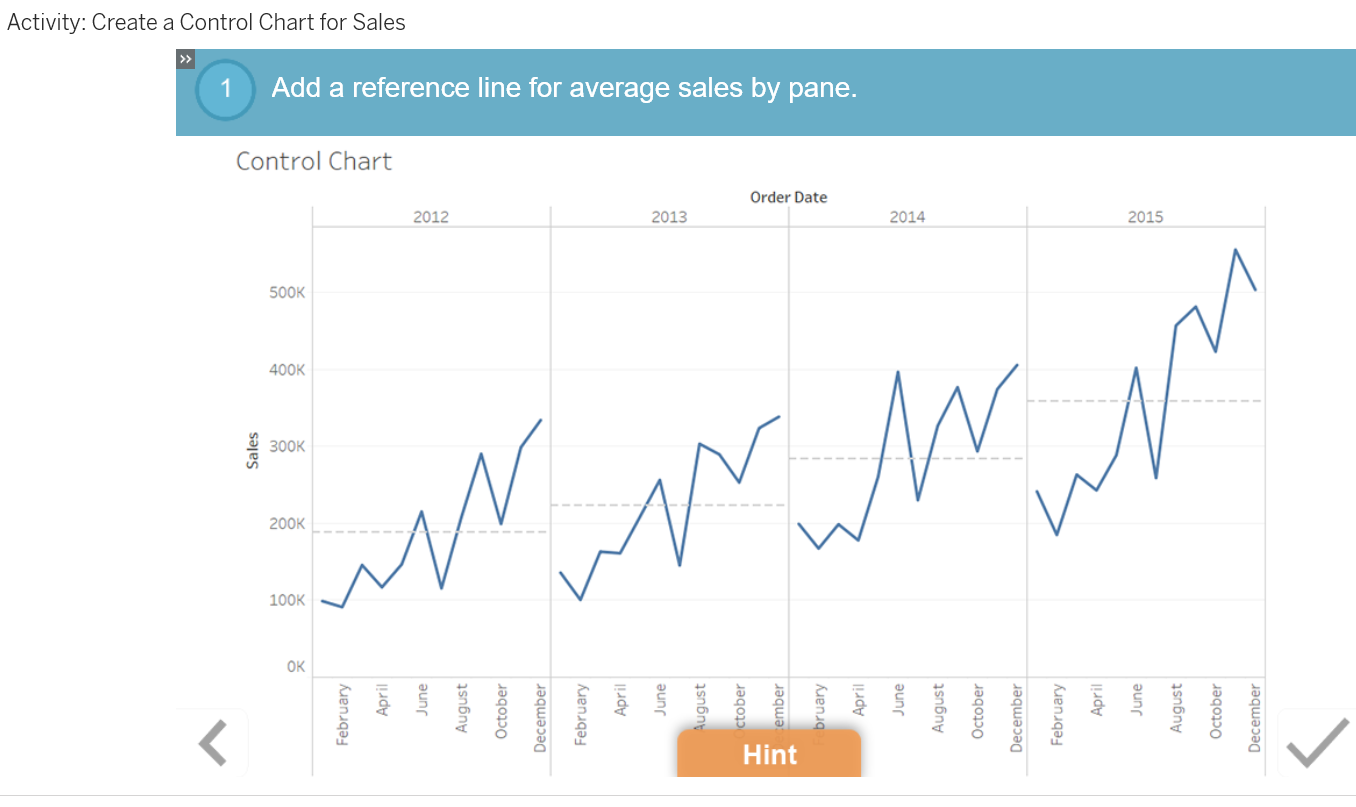
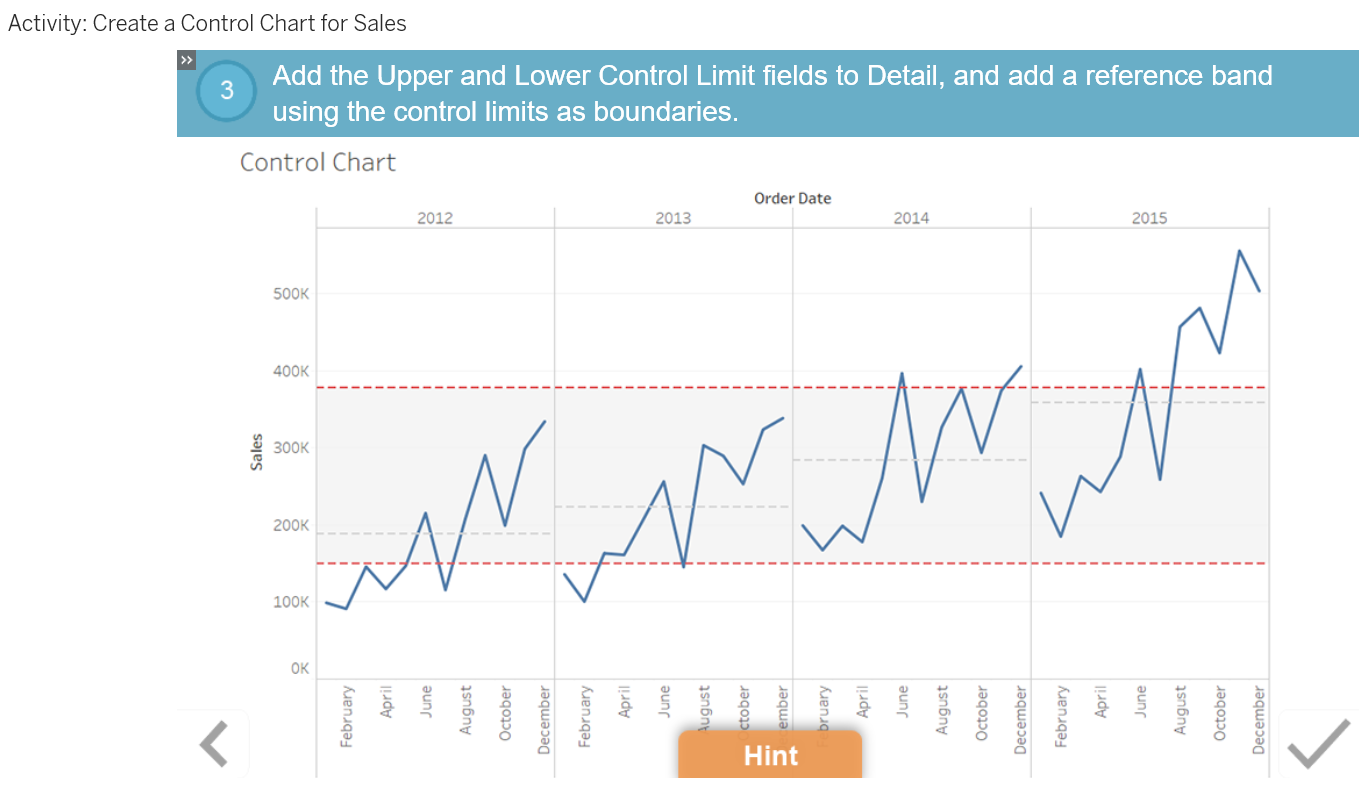
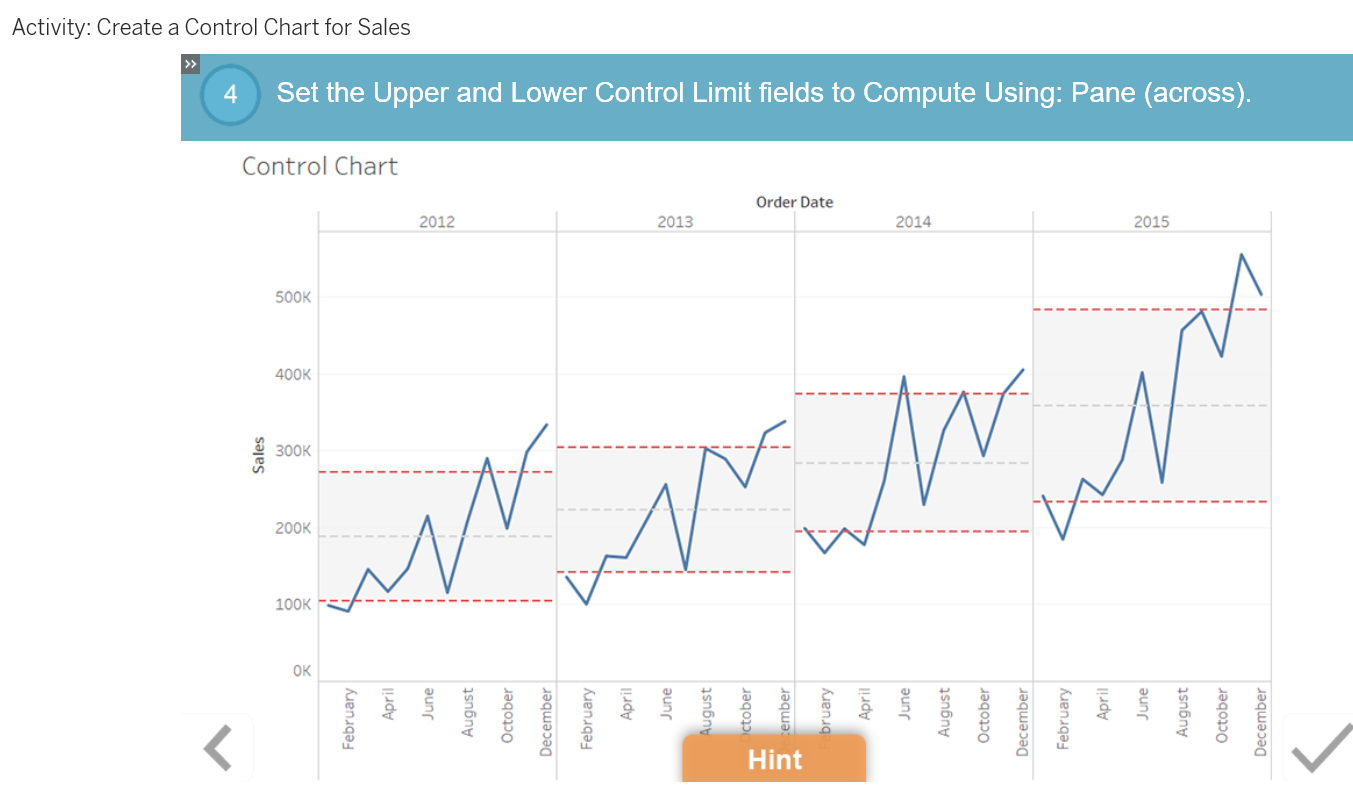
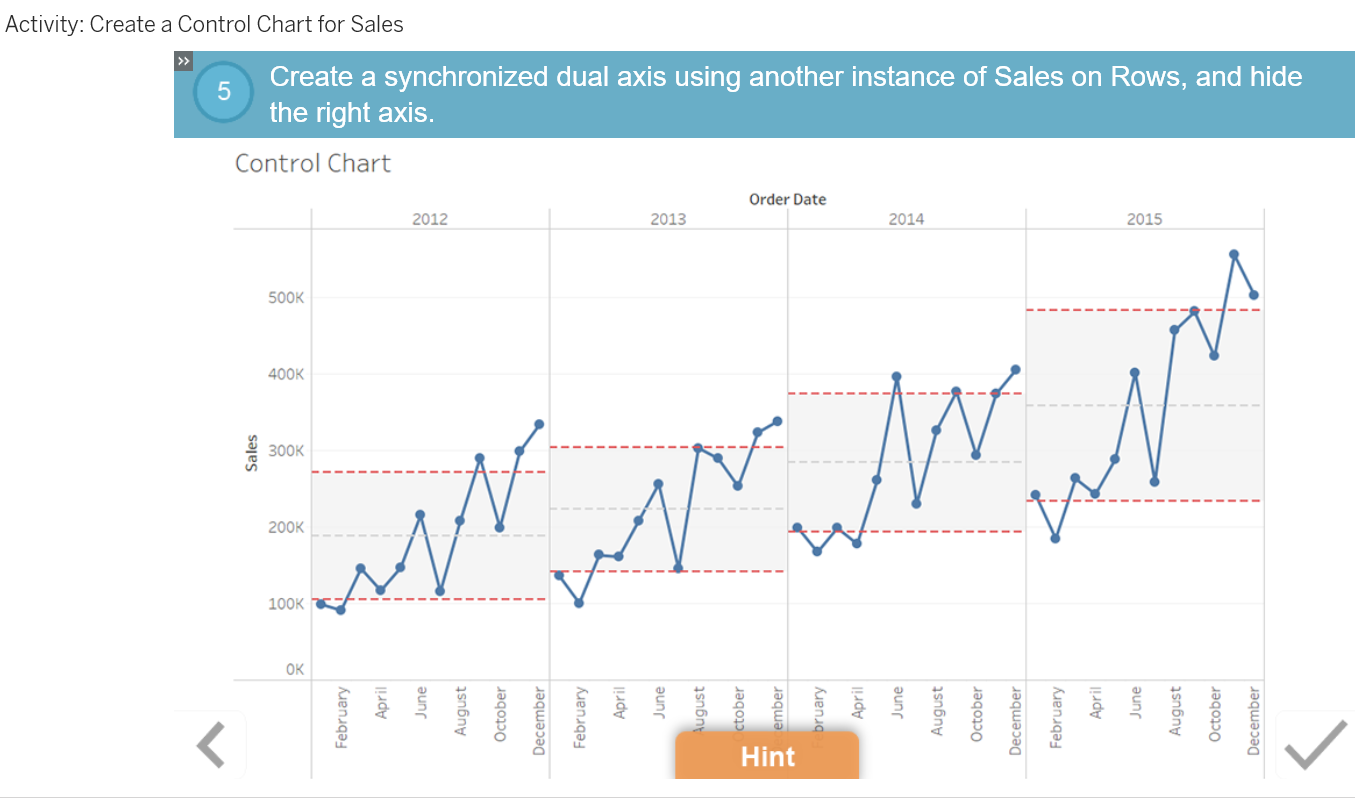
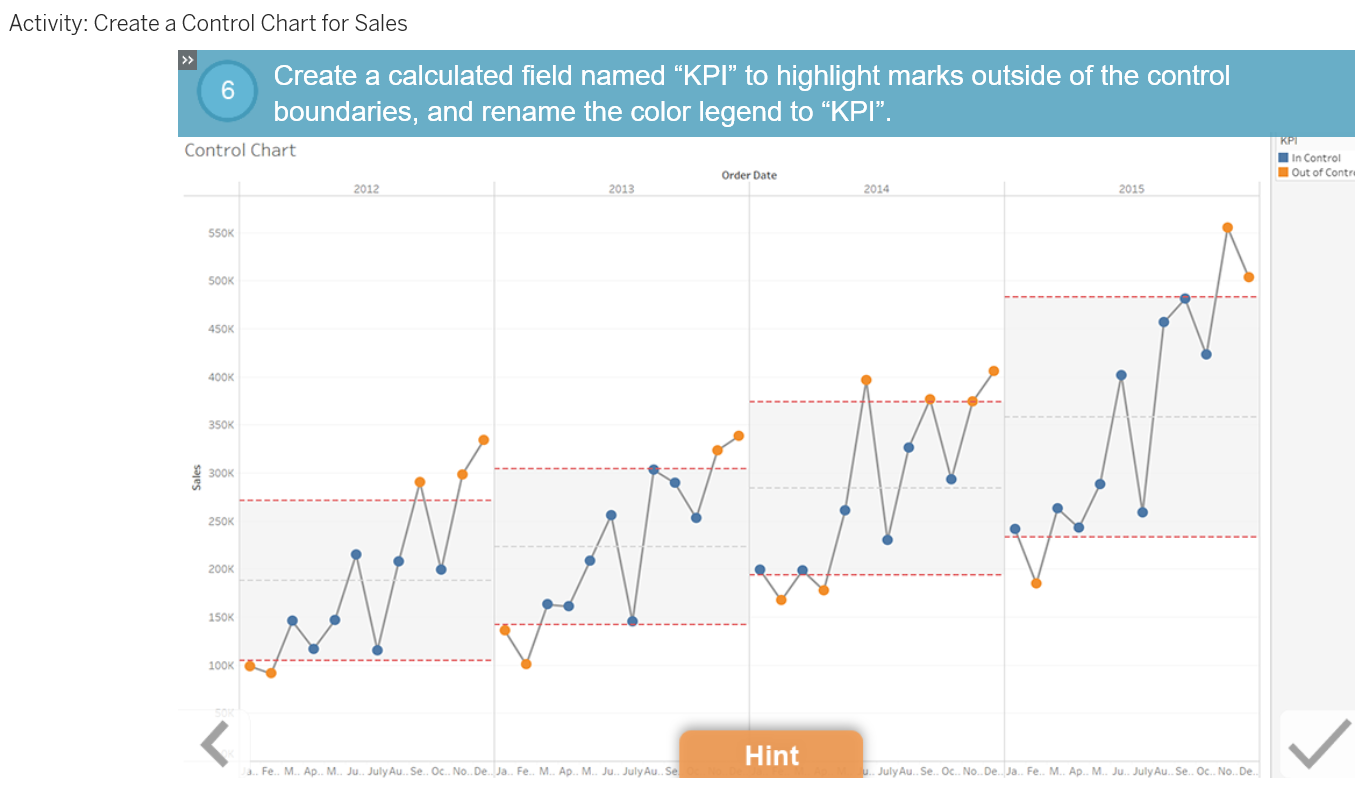
Use control charts to analyze how a process changes over time. A control chart includes a central line for the mean, an upper line for the upper control limit, and a lower line for the lower control limit. These control limits help identify spikes or dips that lie outside of expected or desired behavior. Use these outliers to draw conclusions about variations in the process so that corrective action can be taken.
Lesson Objectives
At the end of this lesson, you will be able to:
- Create a control chart.
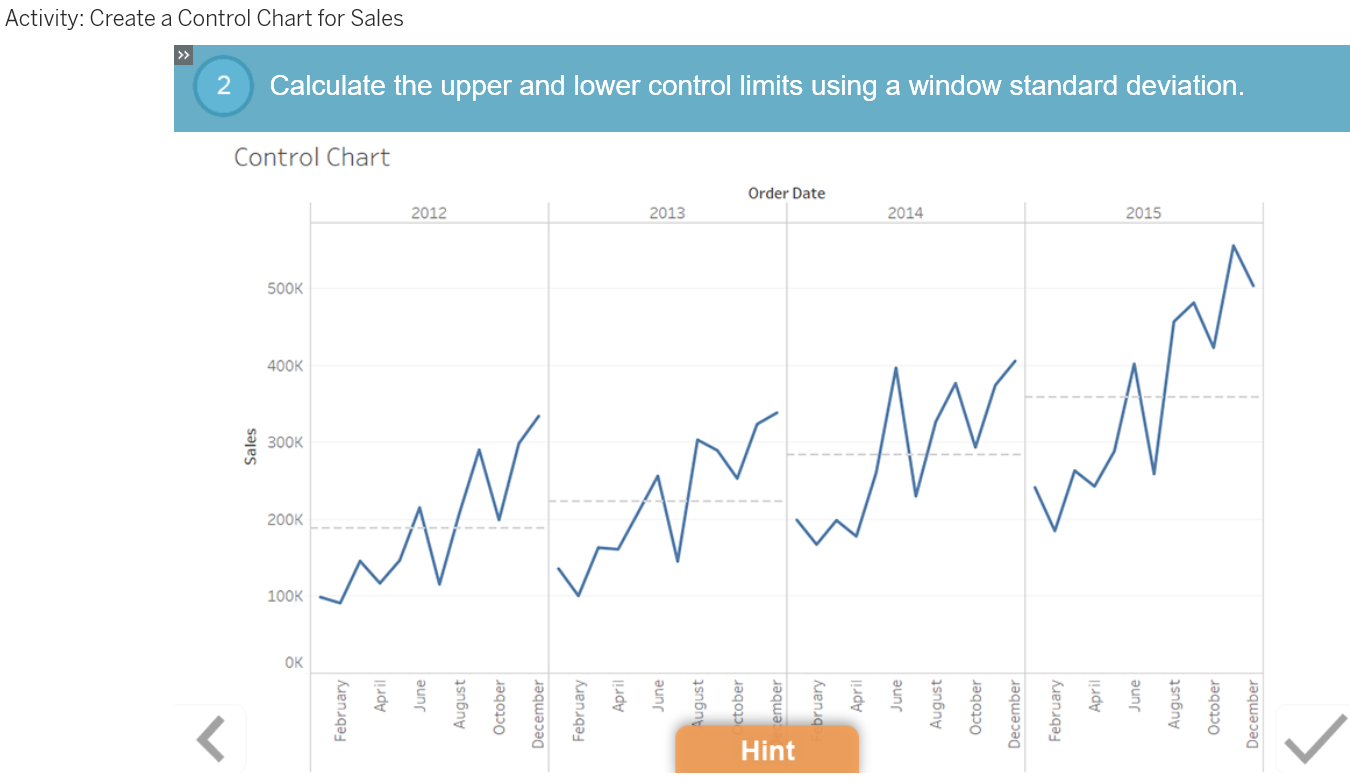
- Use WINDOW functions to calculate control boundaries.
- Format a control chart.
