Customer Behavior: Analyze Survey Data
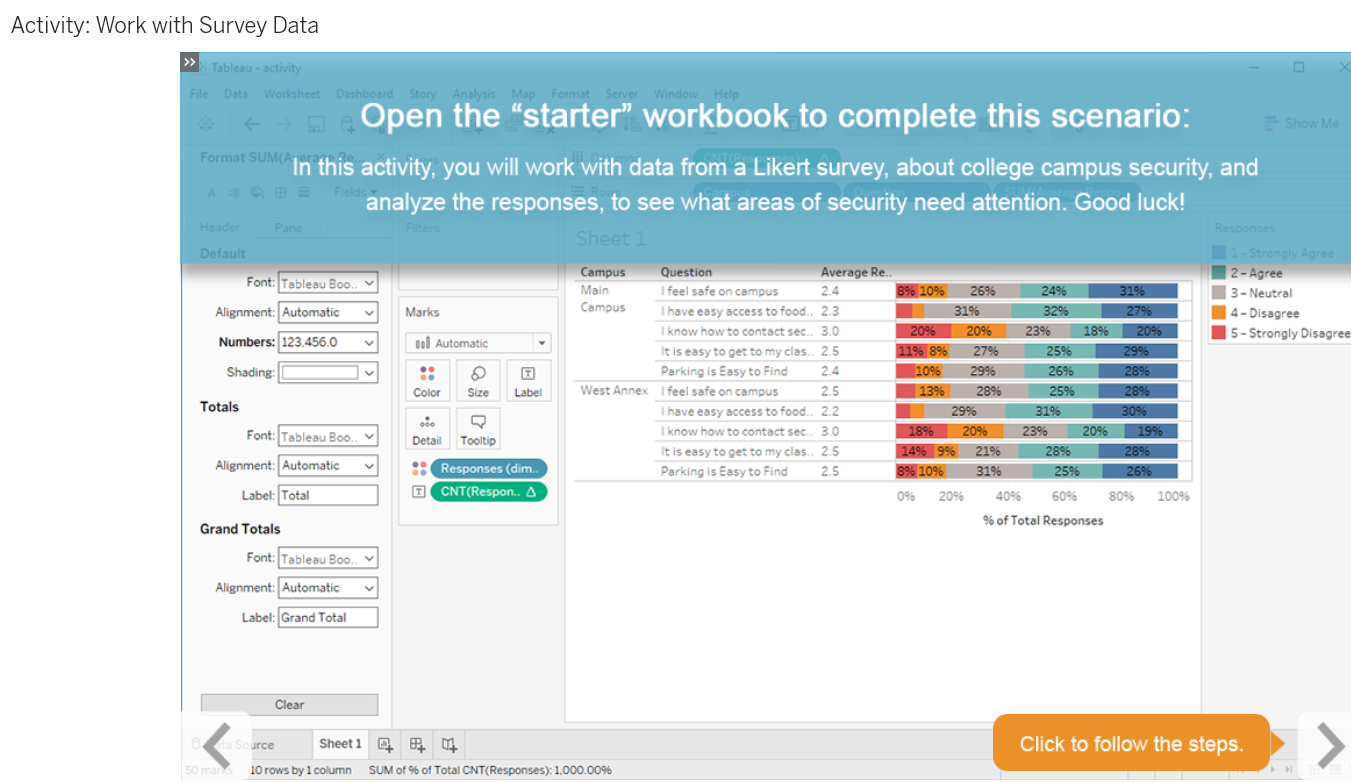
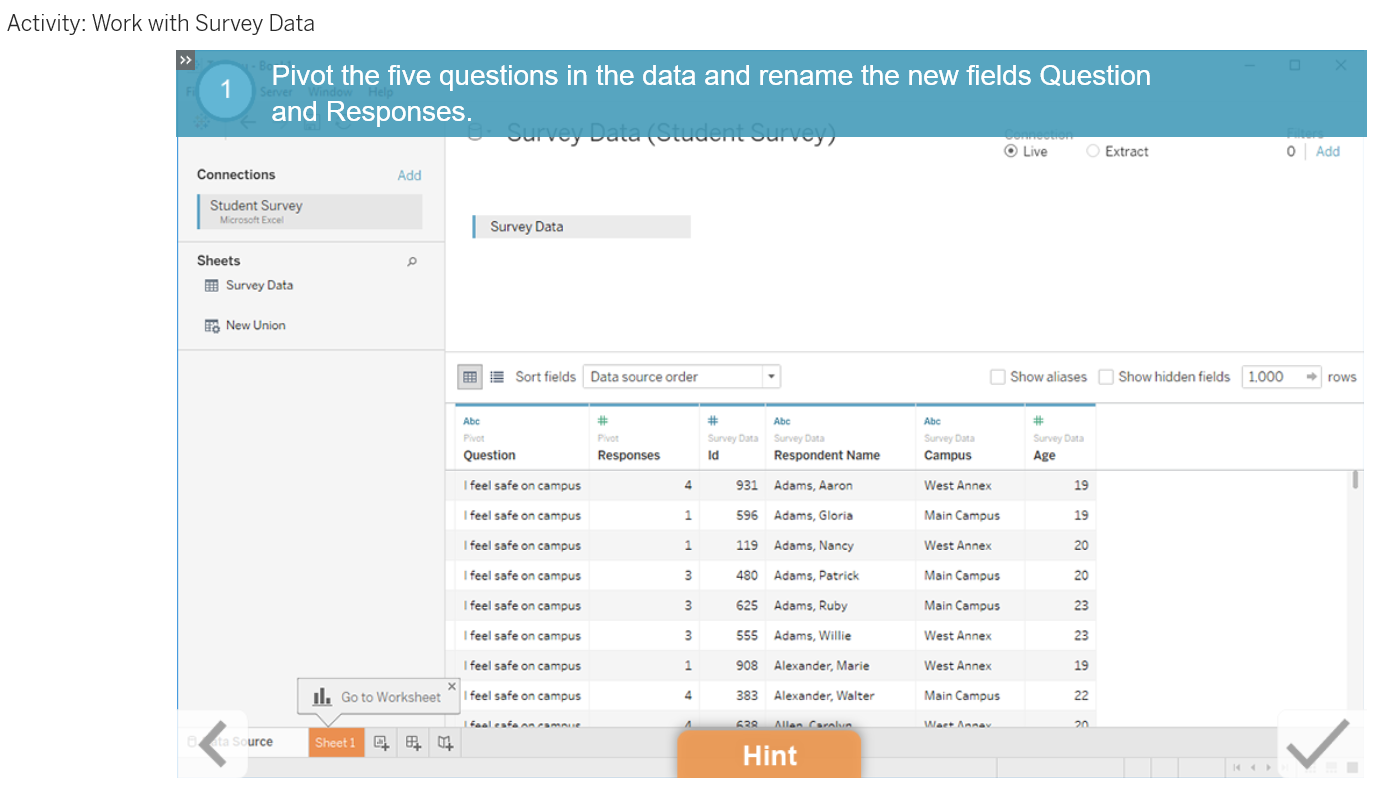
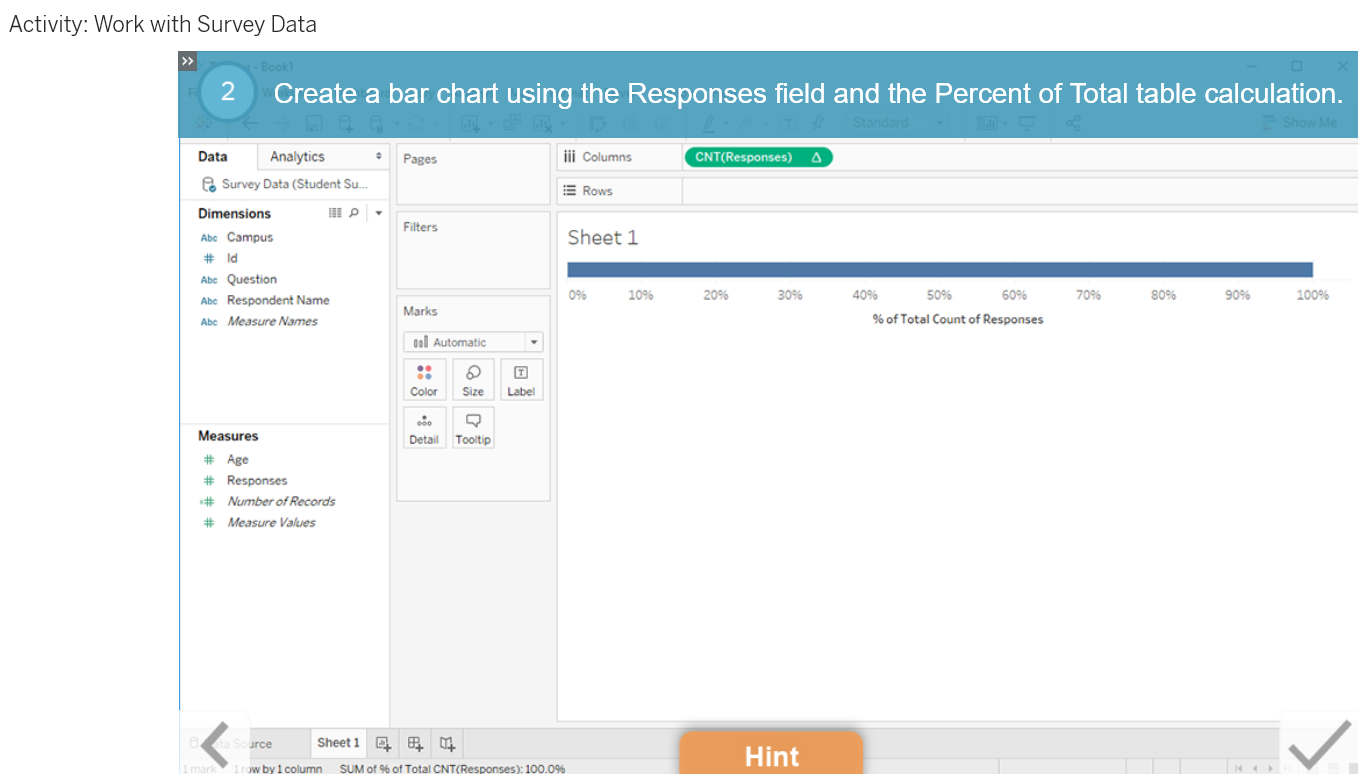
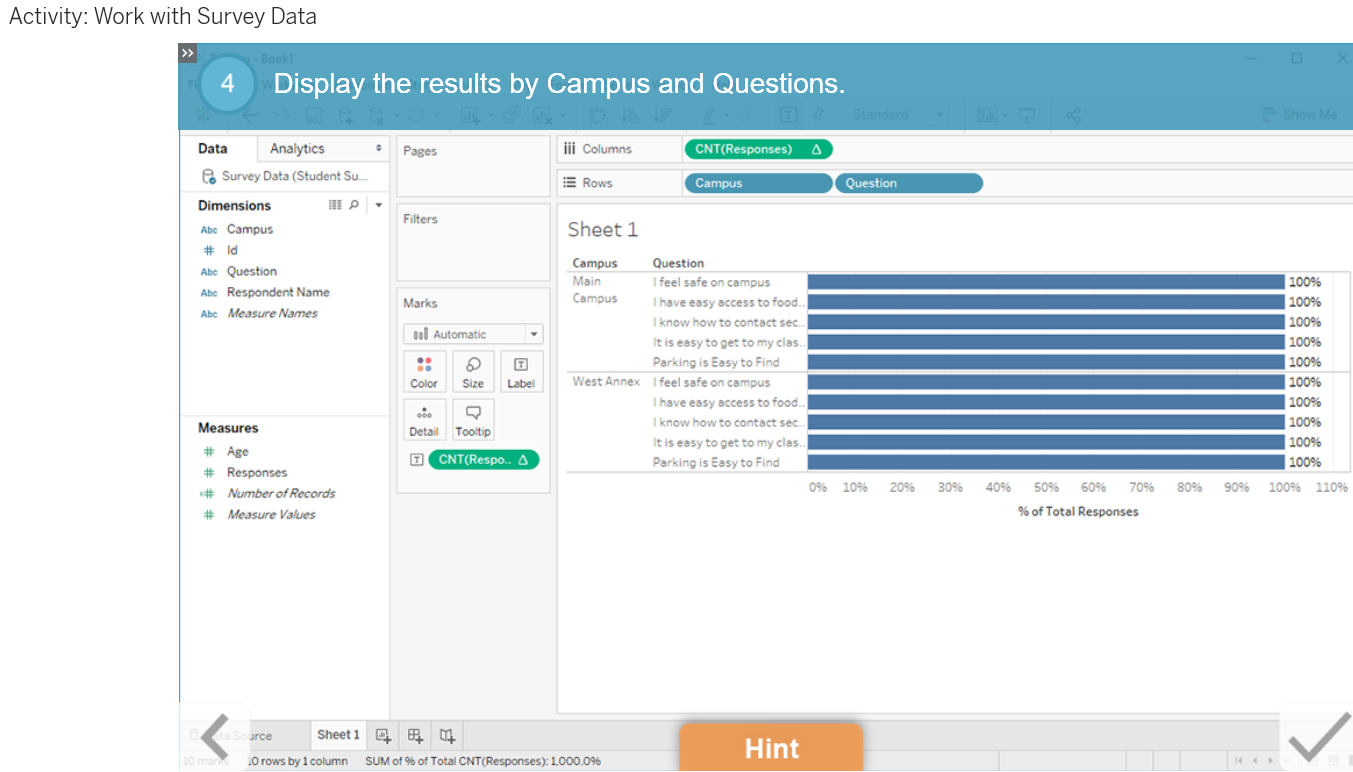
Examining results from a Likert-based survey is easier than ever to interpret once you've built this visualization. Pivot your data so that you can break down results and look at average responses.
At the end of this lesson, you will be able to:
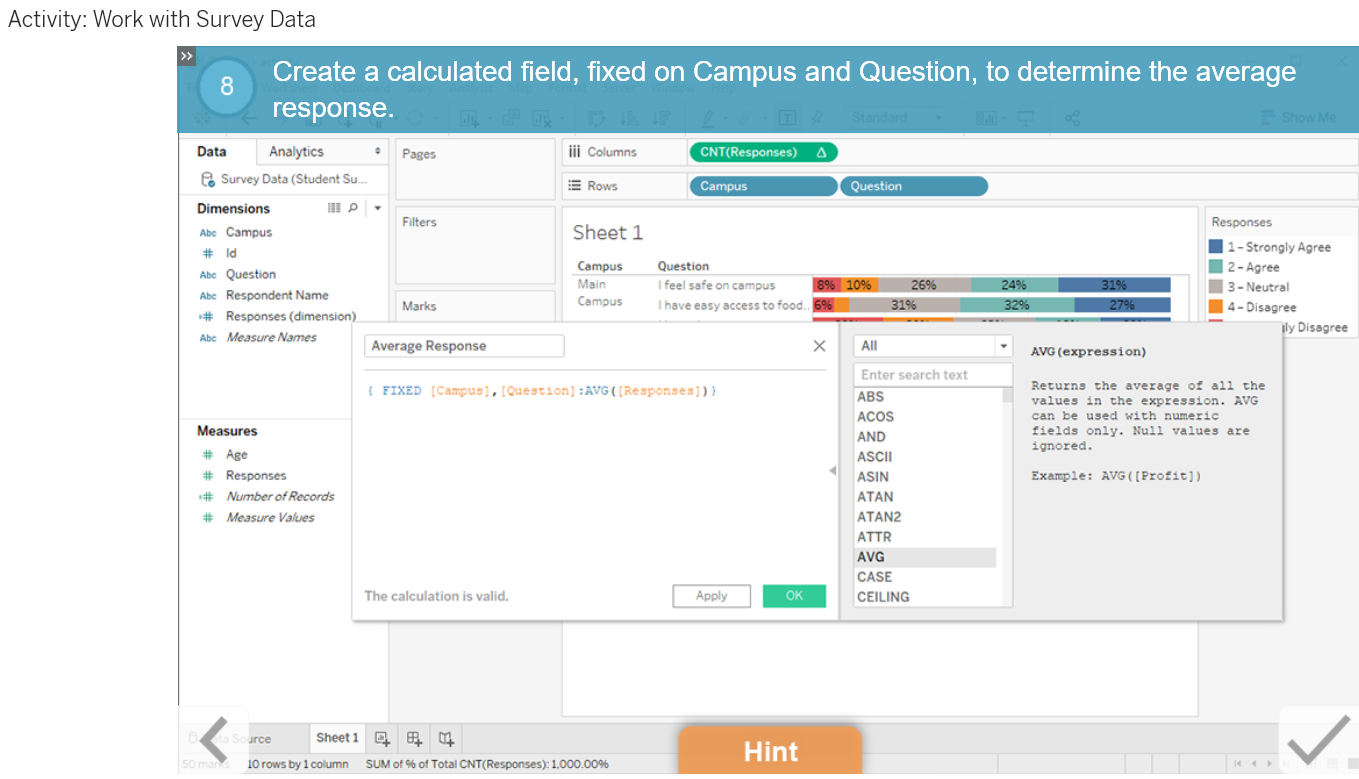
- Recall the LOD expression for grouping responses.
- Pivot survey data to support making it visual.
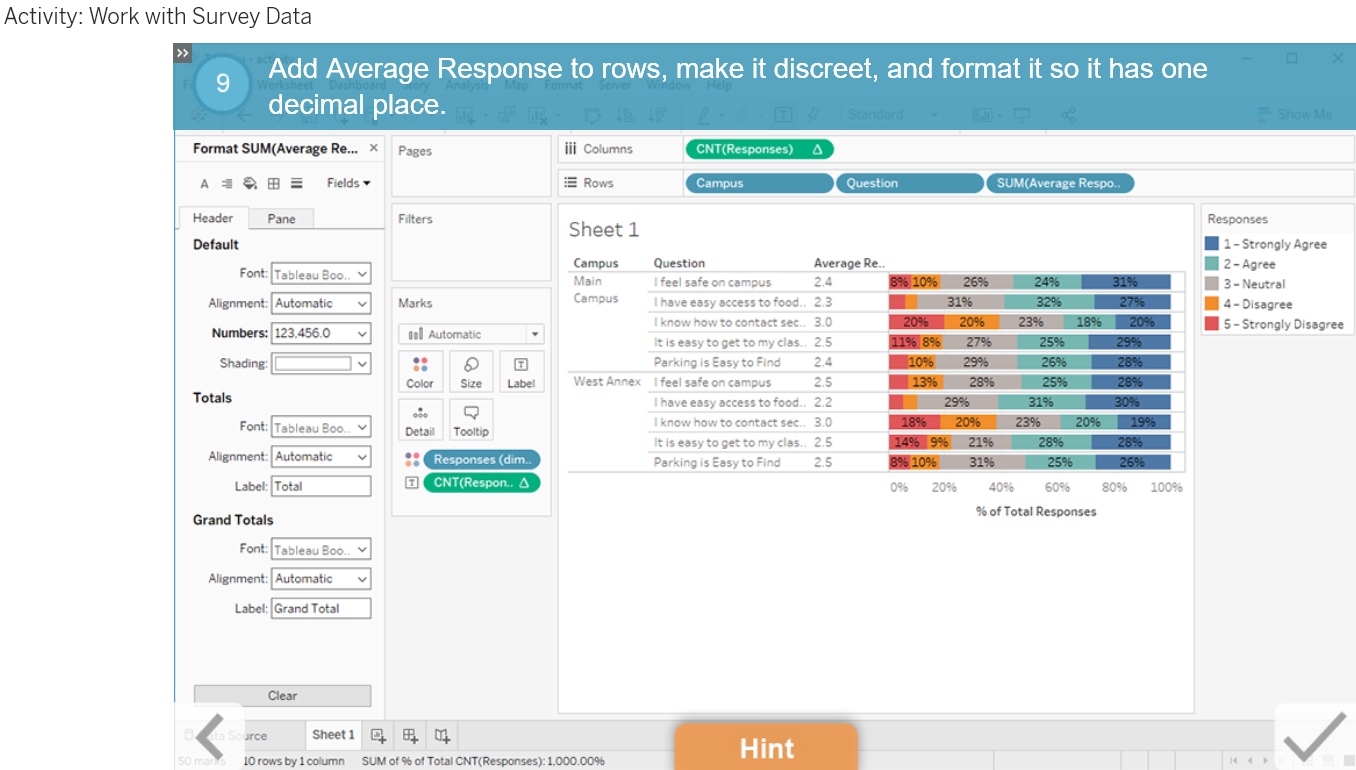
- Show a meaningful visualization of qualitative survey data.
