Geographic Analysis: Map Dense Data with Hexbins
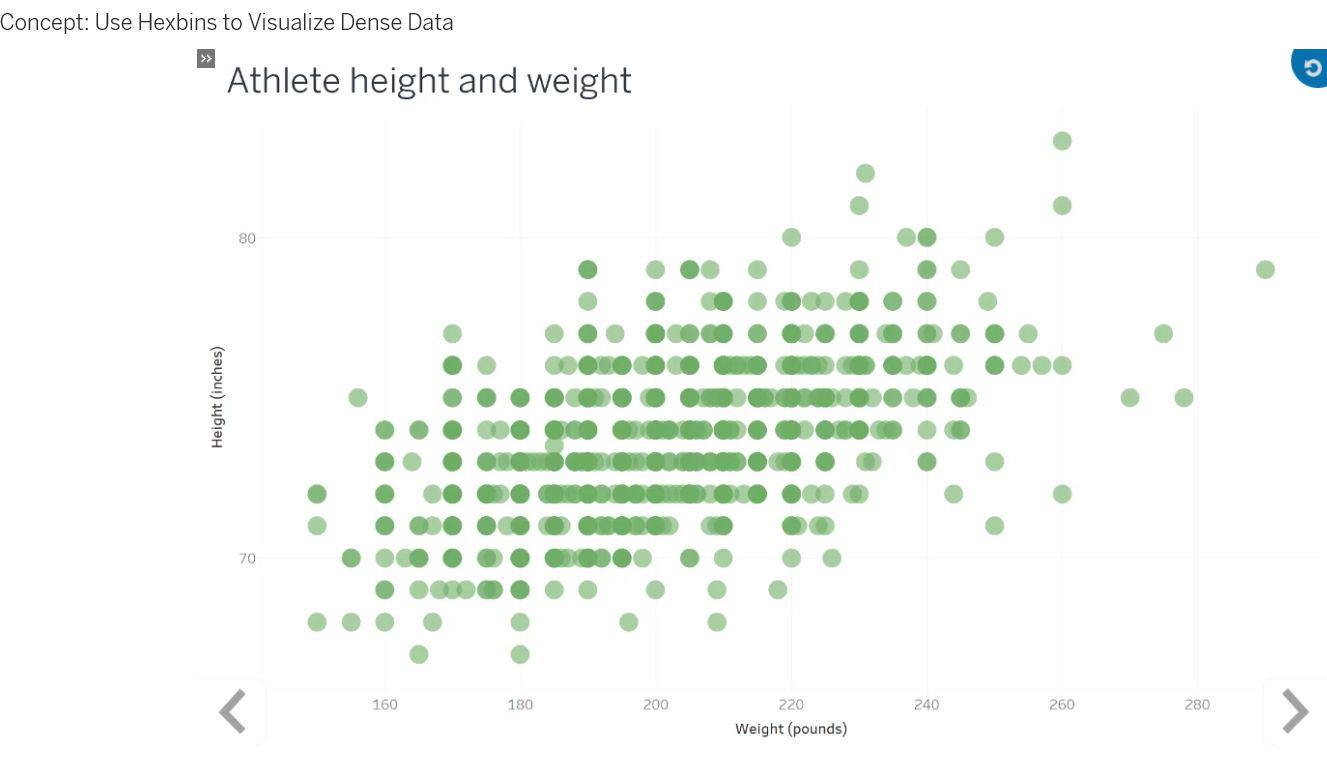
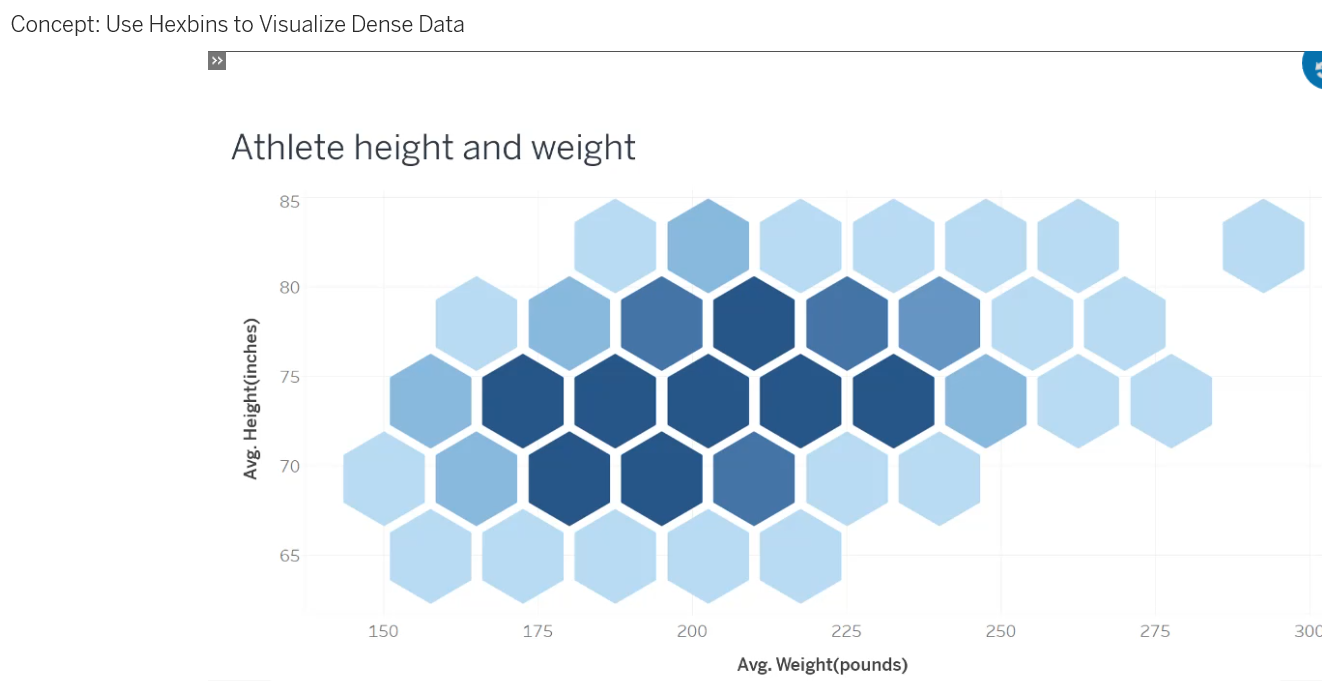
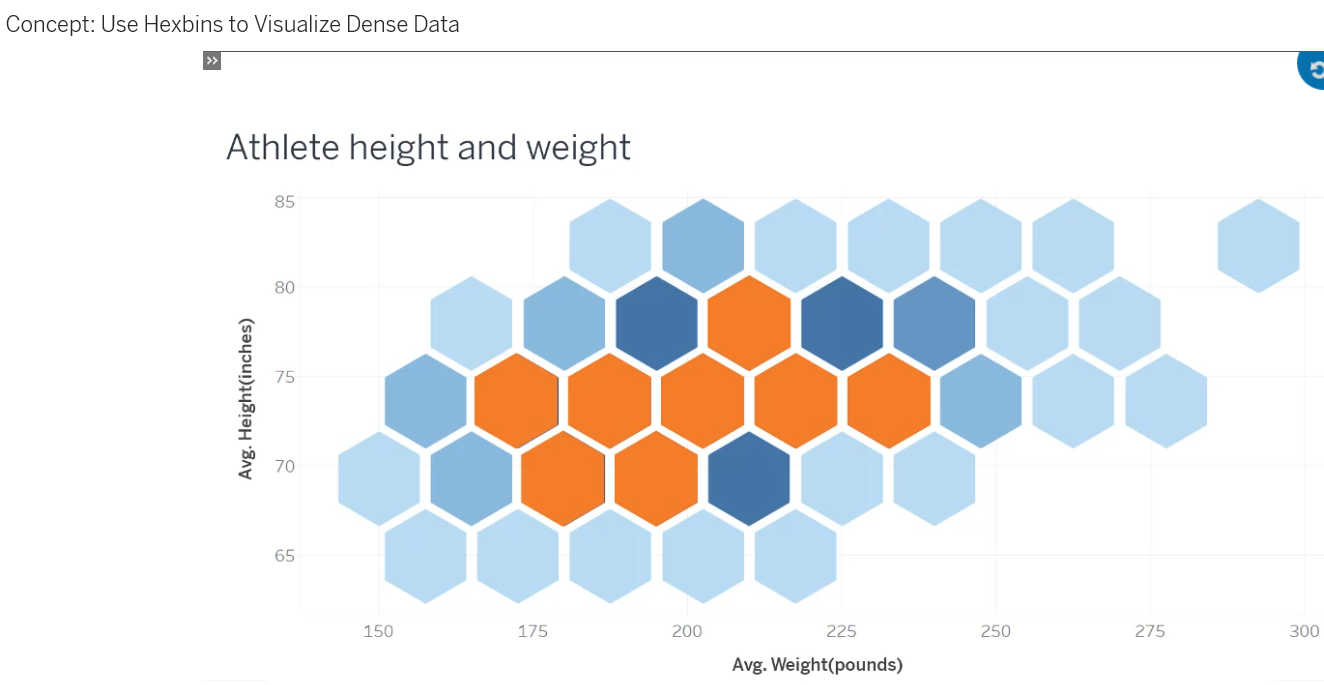
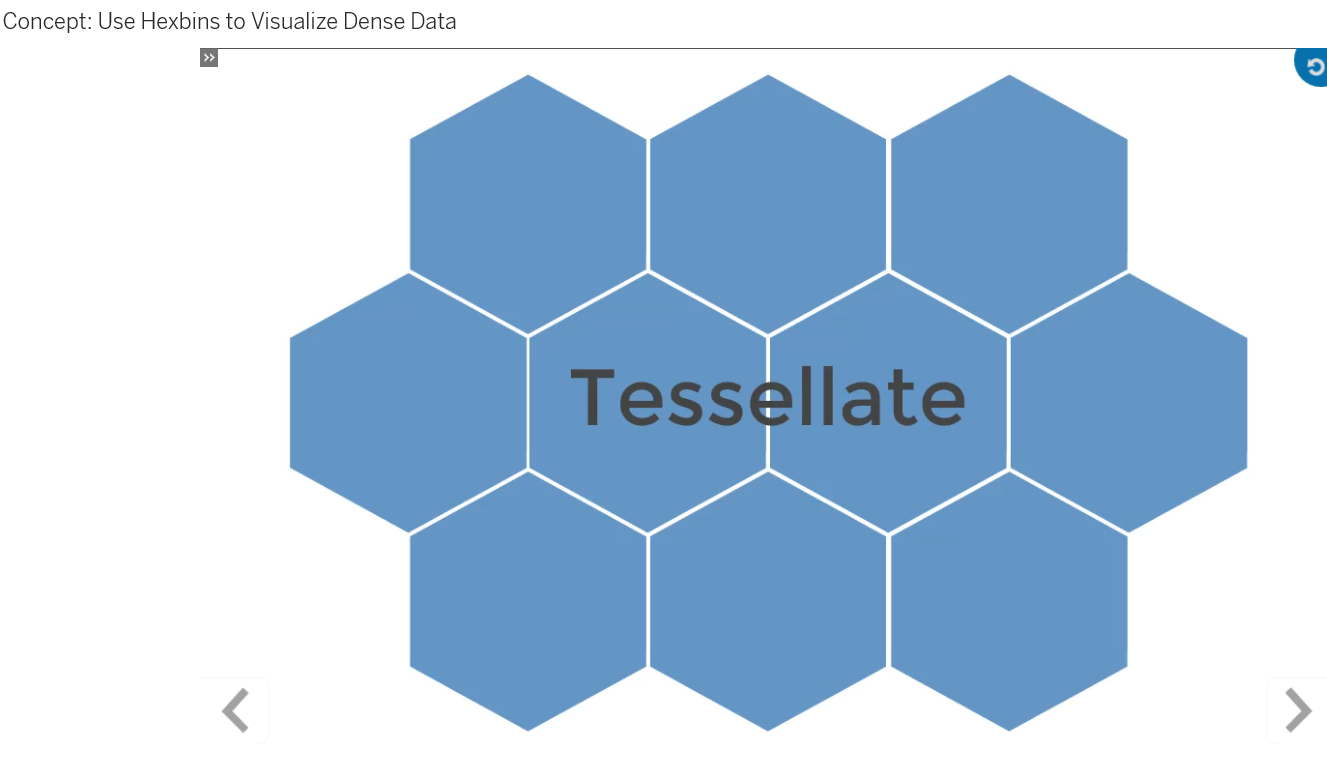
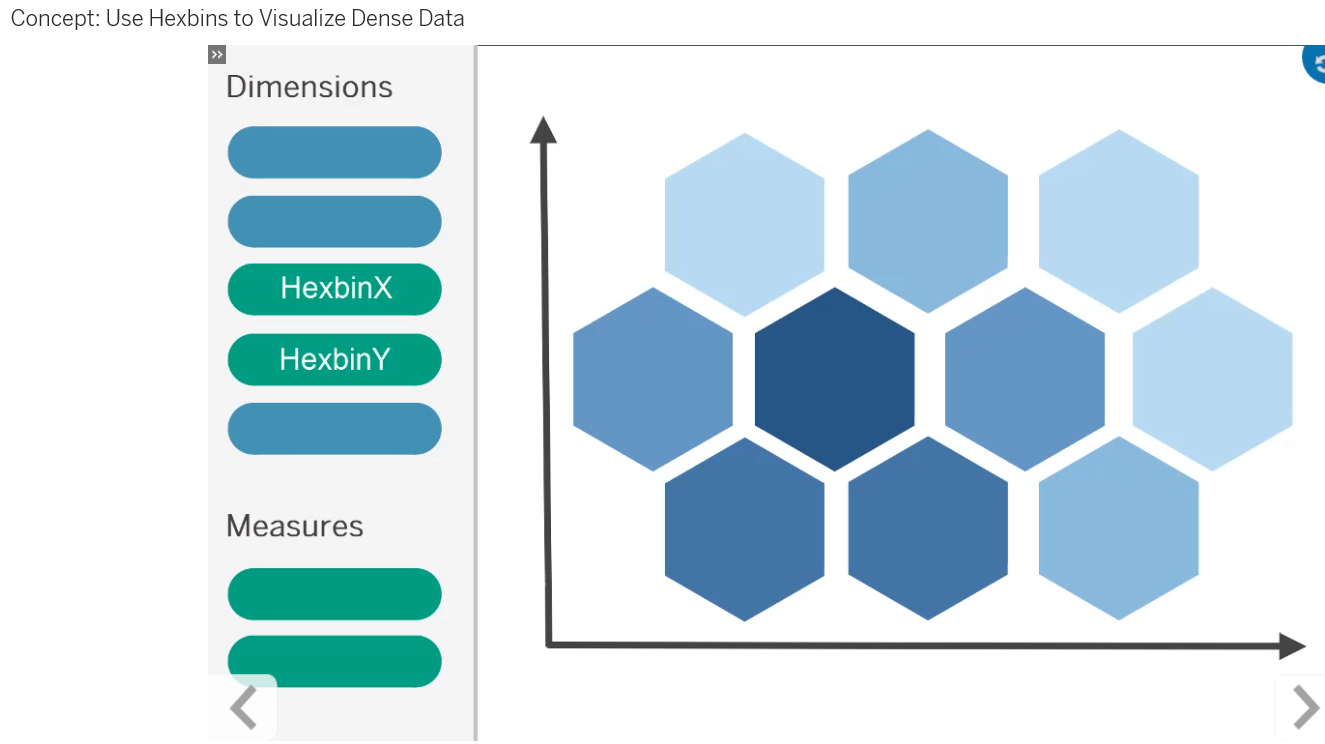
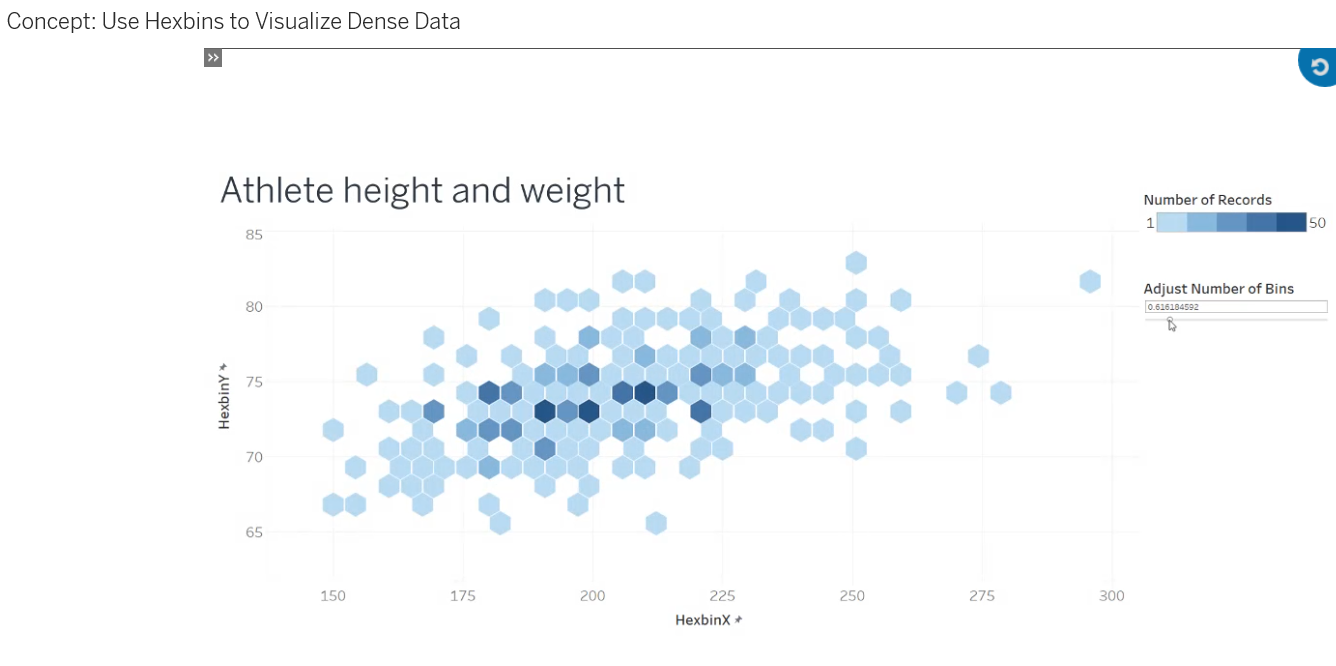
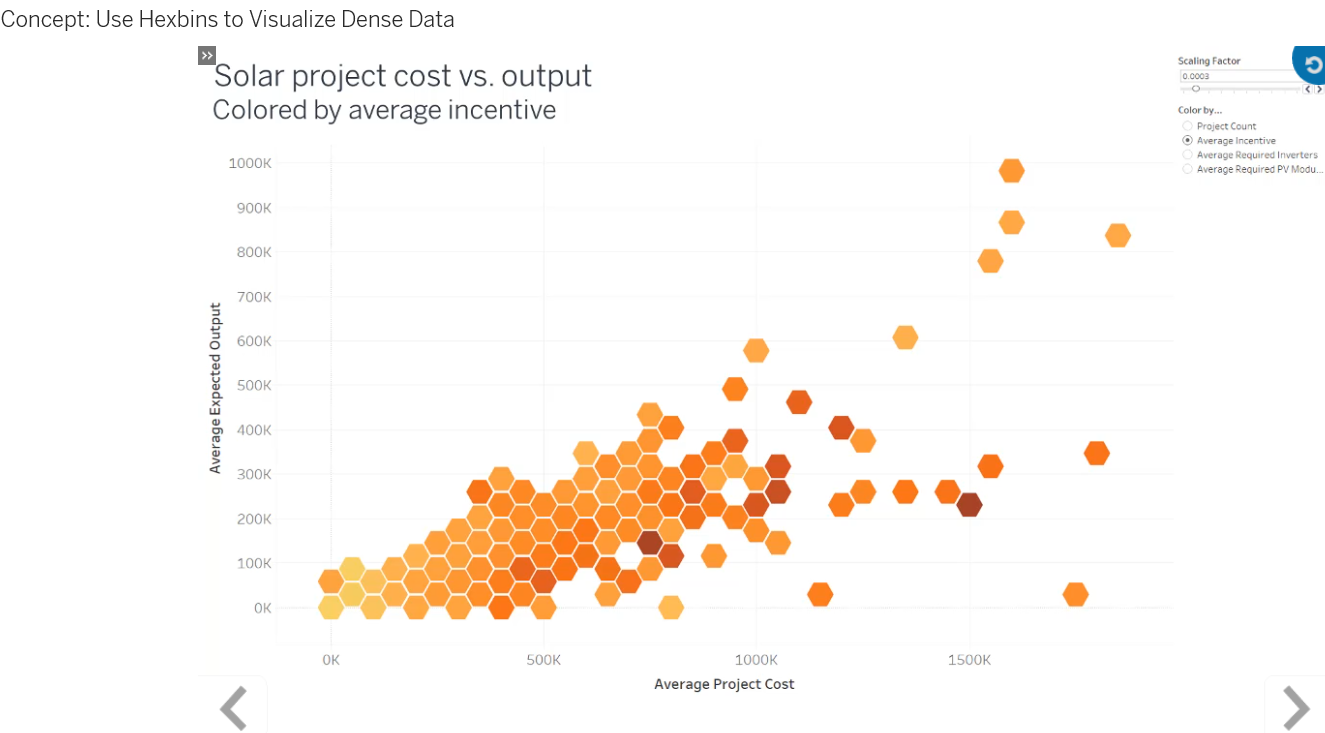
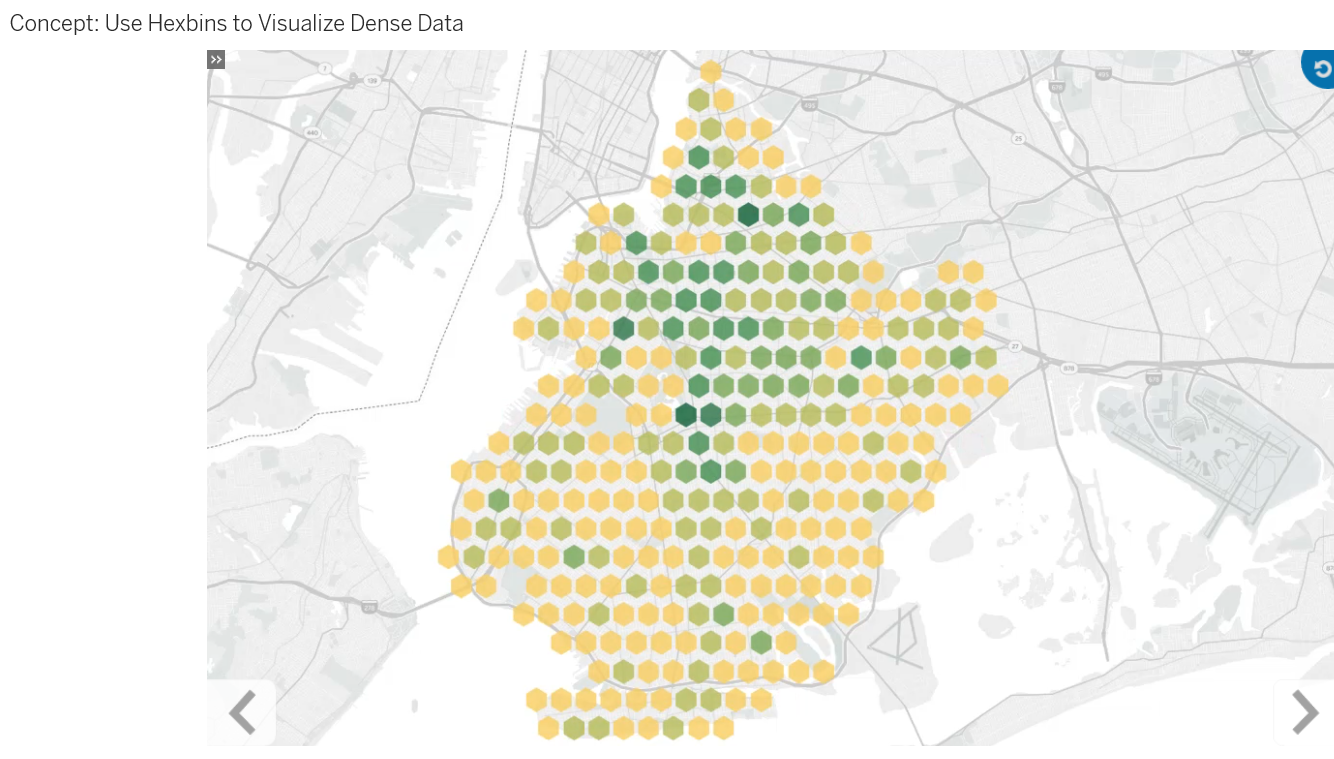
To show the distribution of data between two or three measures, use hexbins, also known as density plots. Like histograms, hexbins create bins for two-dimensional data, and you can put a third measure on color.
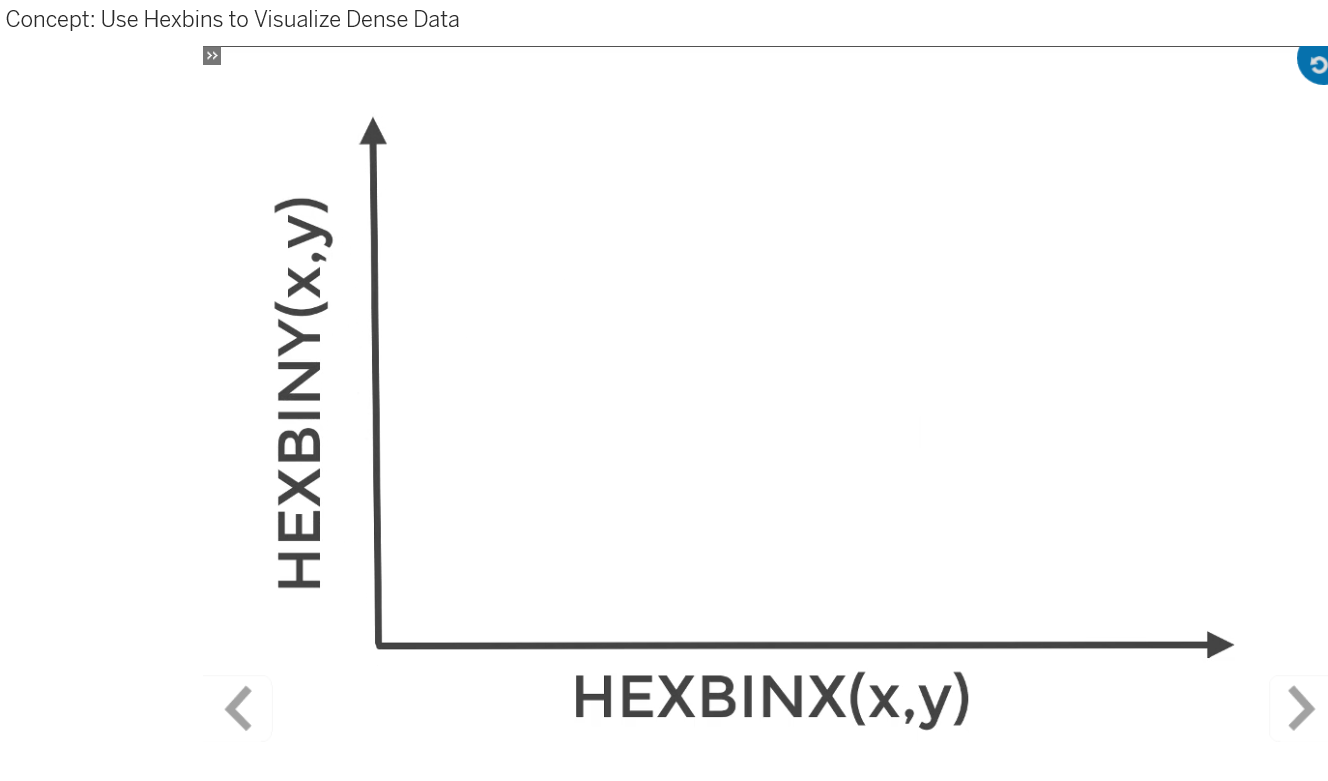
To form hexbins, you'll create HexbinX and HexbinY calculations. You’ll also create a parameter to scale the bins in the view. Hexbins are effective in showing dense data in scatter plots or distributions on top of a geographic map.
Lesson Objectives
At the end of this lesson, you will be able to:
- Describe the purpose of a hexbin (also called a density plot).
- Identify the calculations required to build a hexbin.
- Describe a typical application of a hexbin.
