Comparing Measures Against a Goal
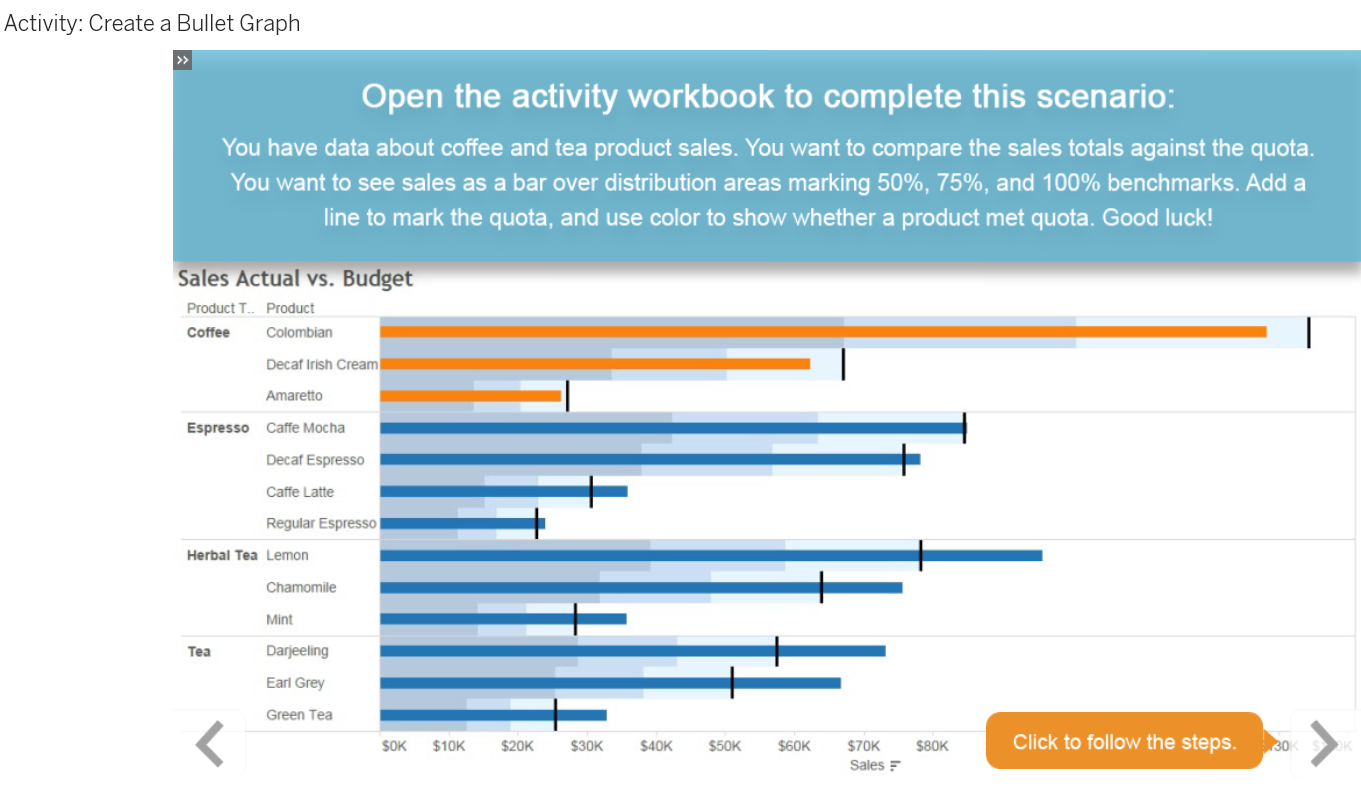
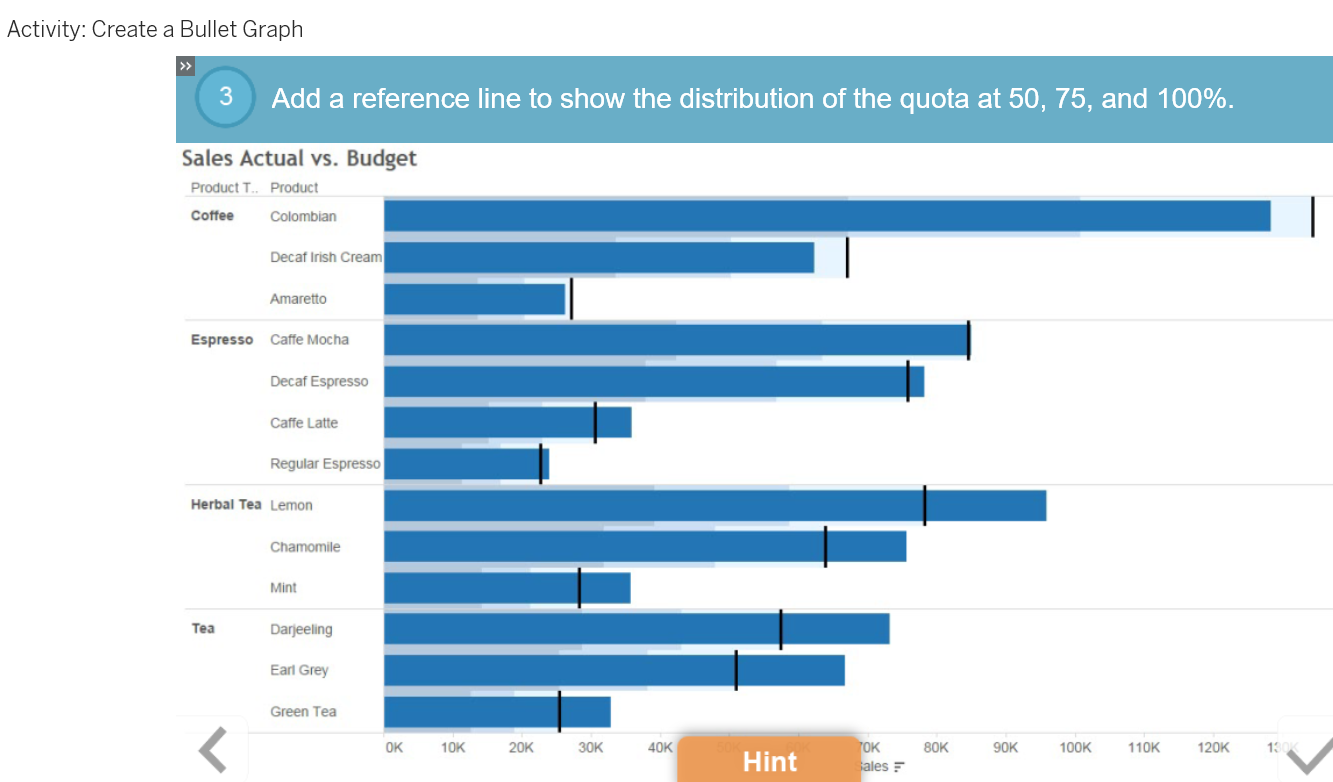
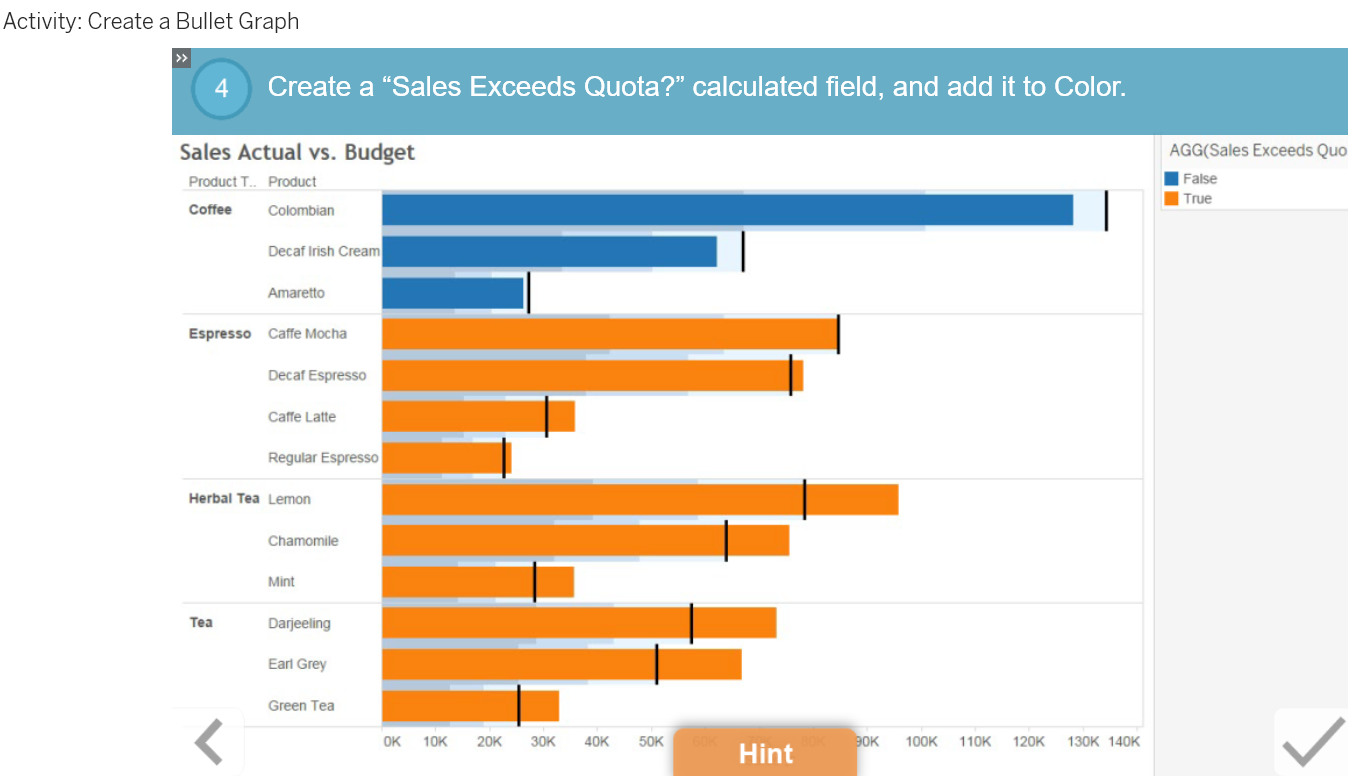
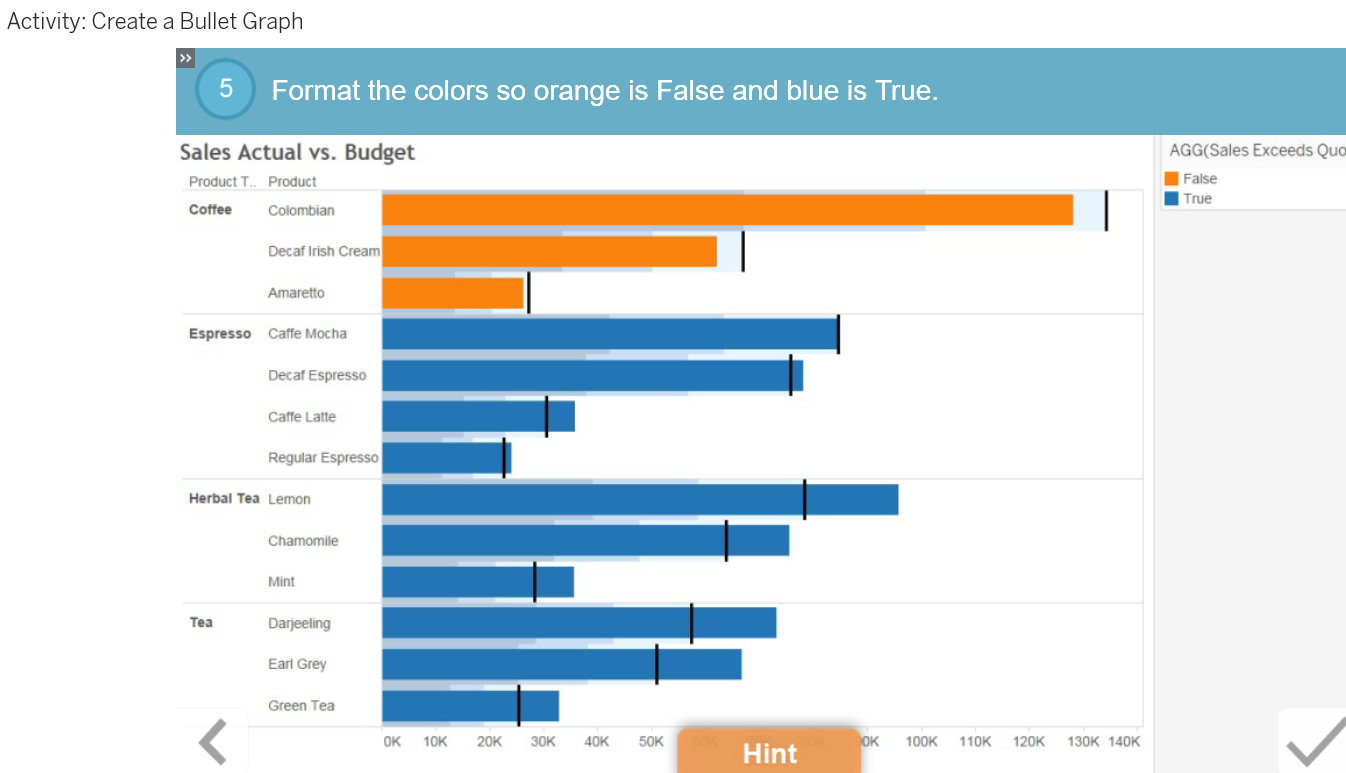
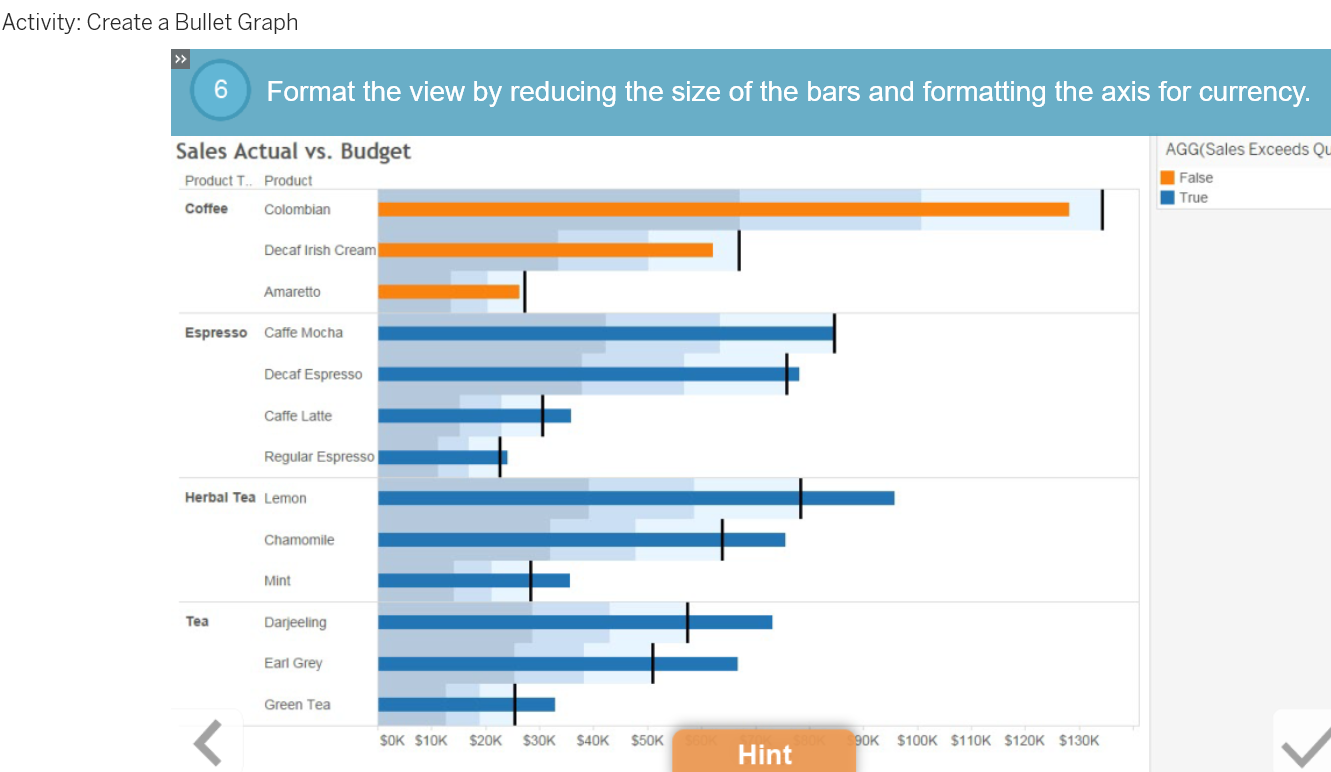
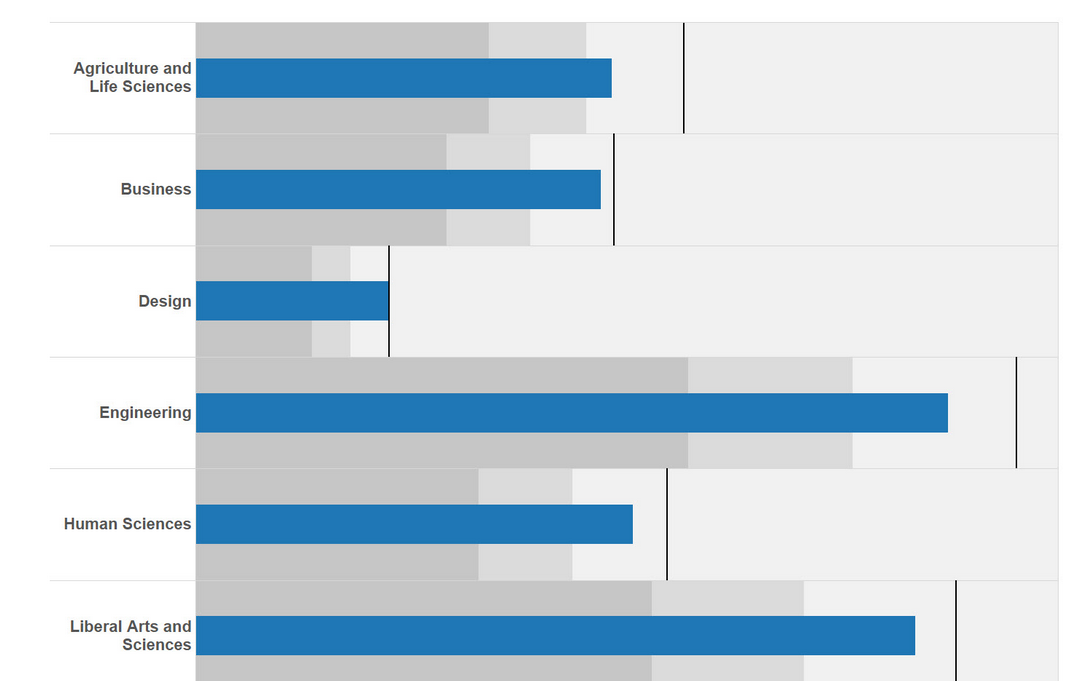
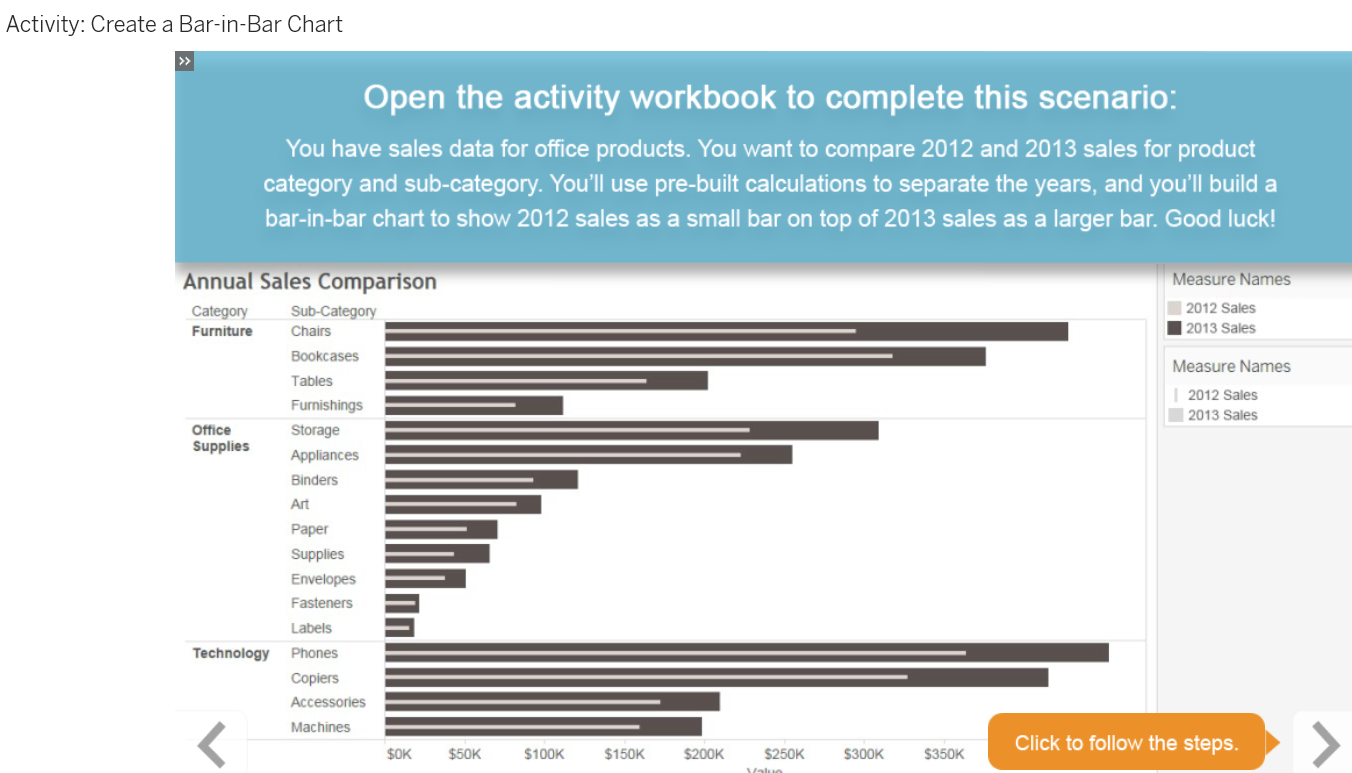
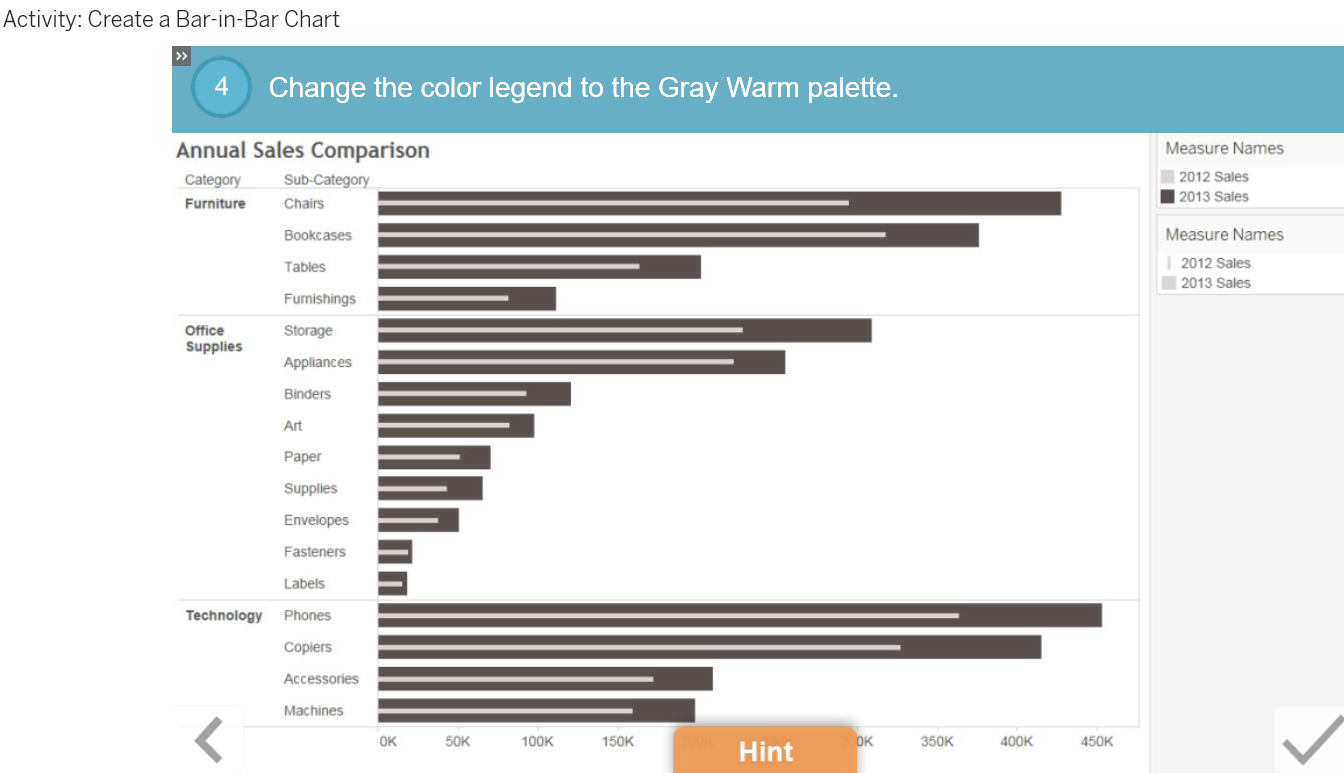
Measures often have relationships to each other and require comparison within a view. What if you wanted to compare your sales to a quota in the same space? Build a bar-in-bar chart to layer bars and show actual sales results against a sales quota. Do you need to show staged progress toward a goal? Build a bullet graph and use reference lines and distribution bands to track the progress of student enrollment toward a maximum.
Lesson Objectives
At the end of this lesson, you will be able to:
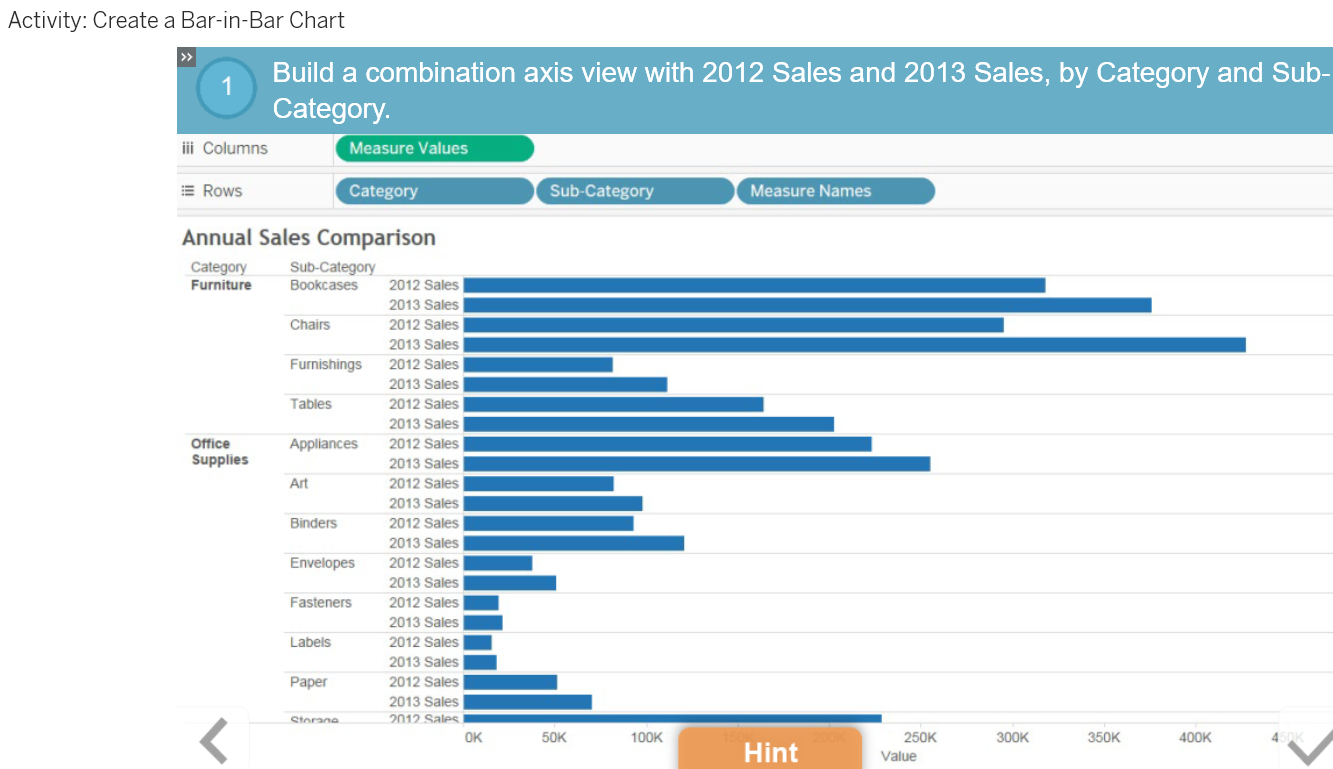
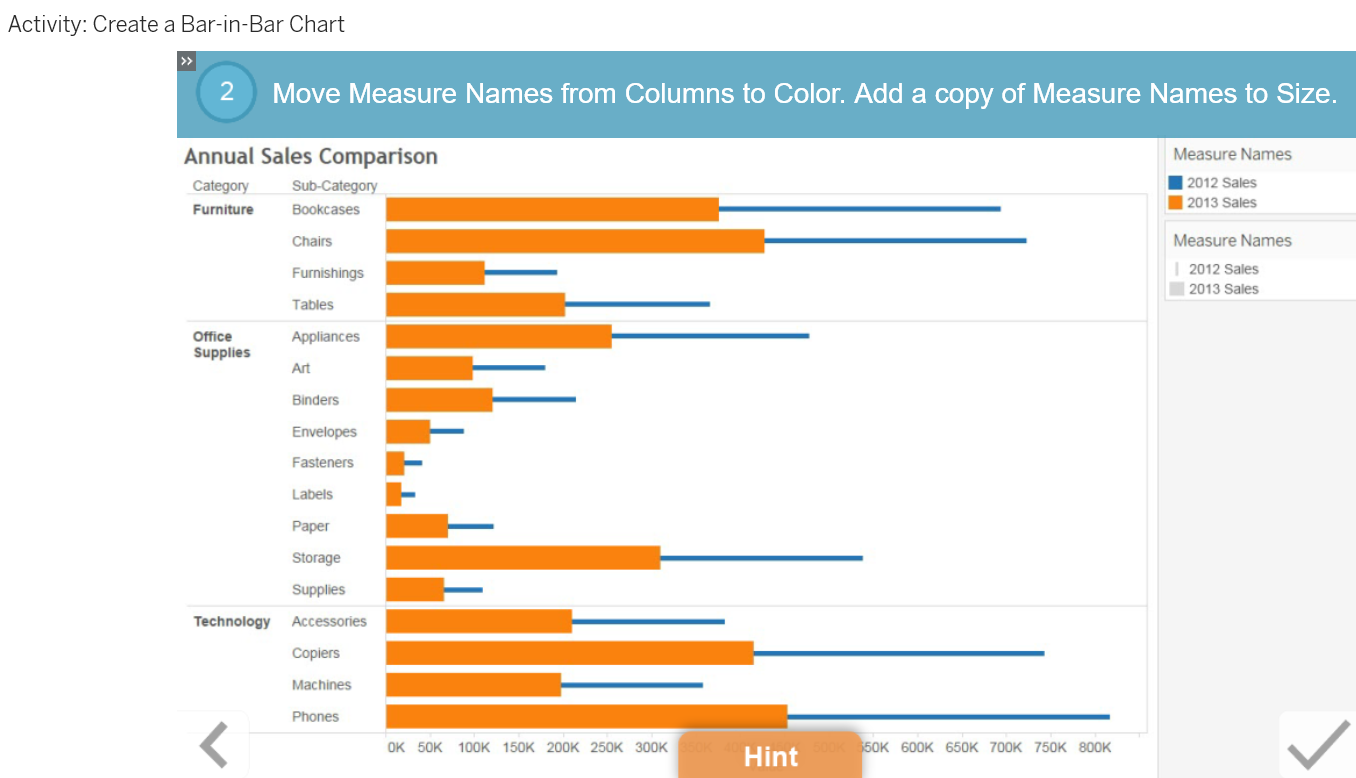
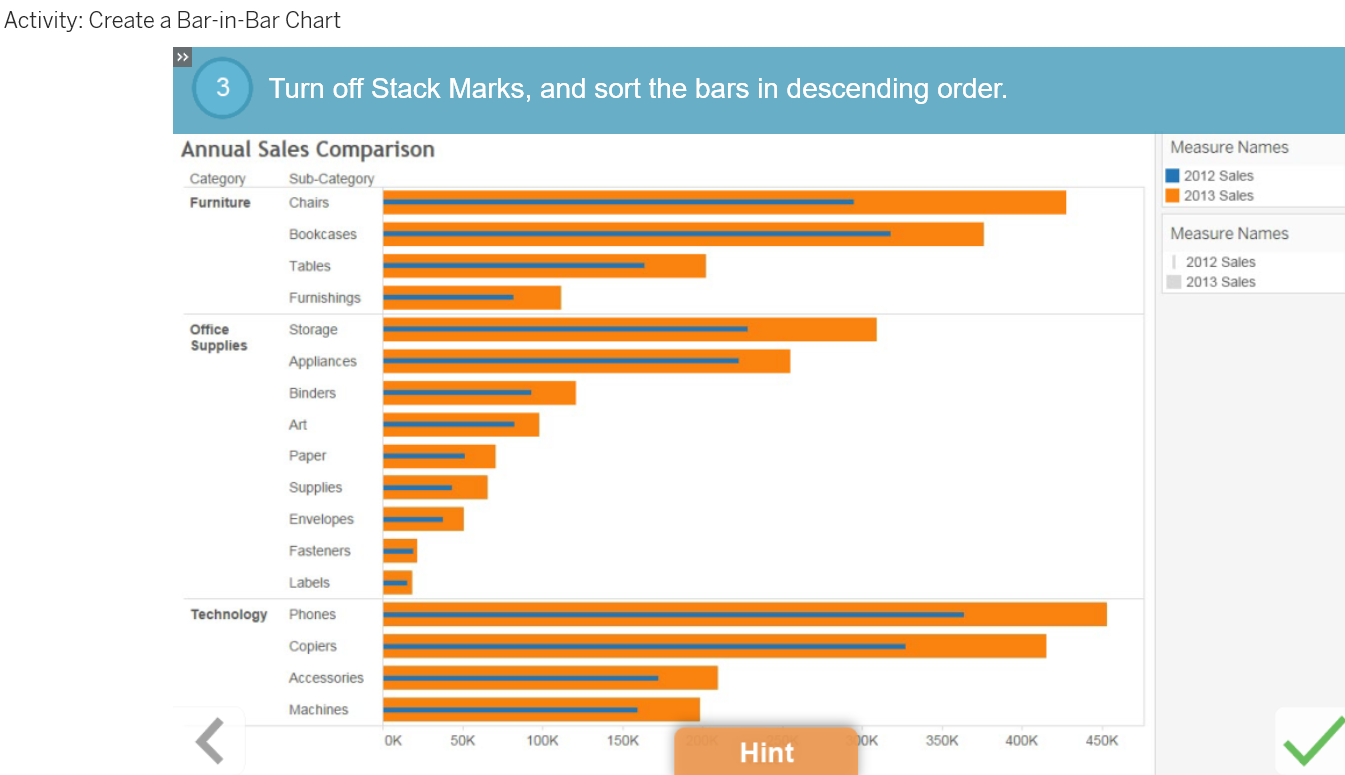
- Create a bar-in-bar chart to compare different years of sales data.
Lesson Objectives
At the end of this lesson, you will be able to:
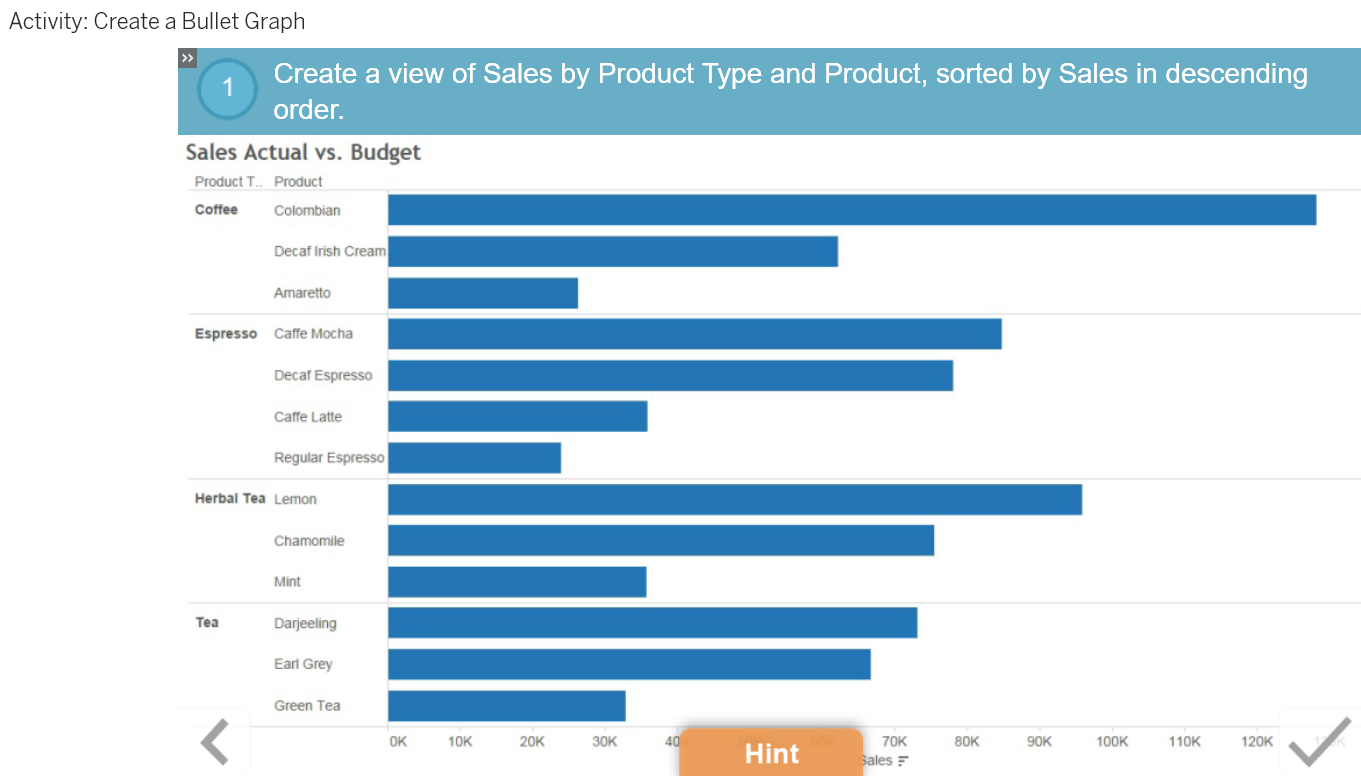
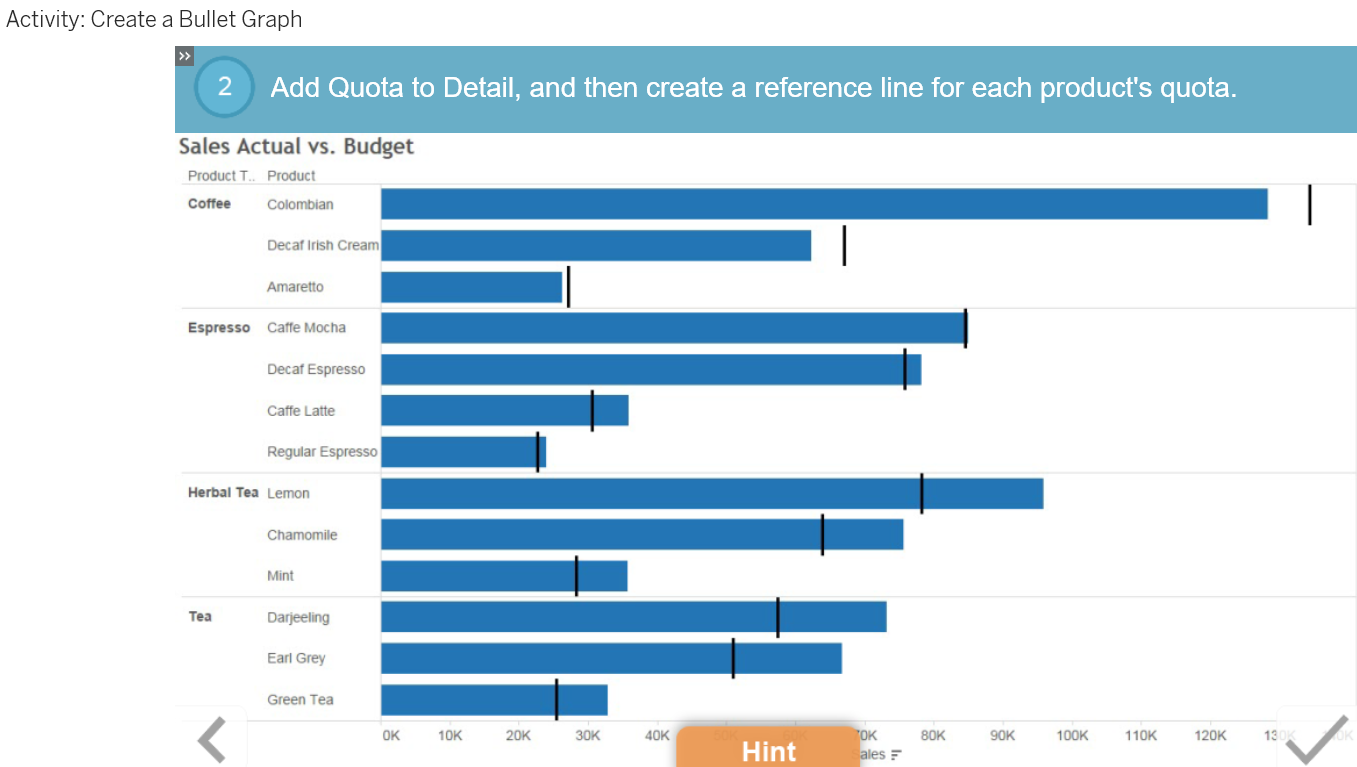
- Create a bullet graph to compare product sales against the sales quota.
