Showing Statistics and Forecasting: Use the Analytics Pane and Trend Lines
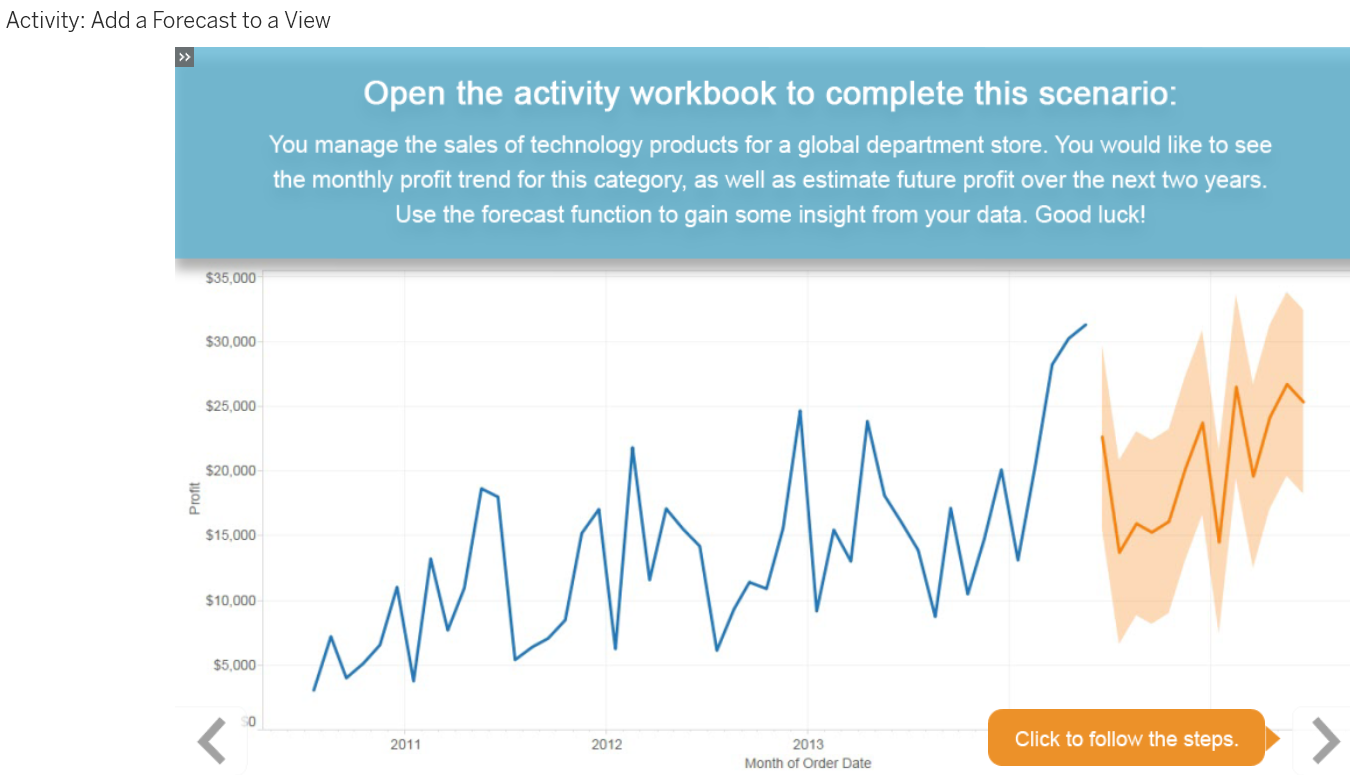
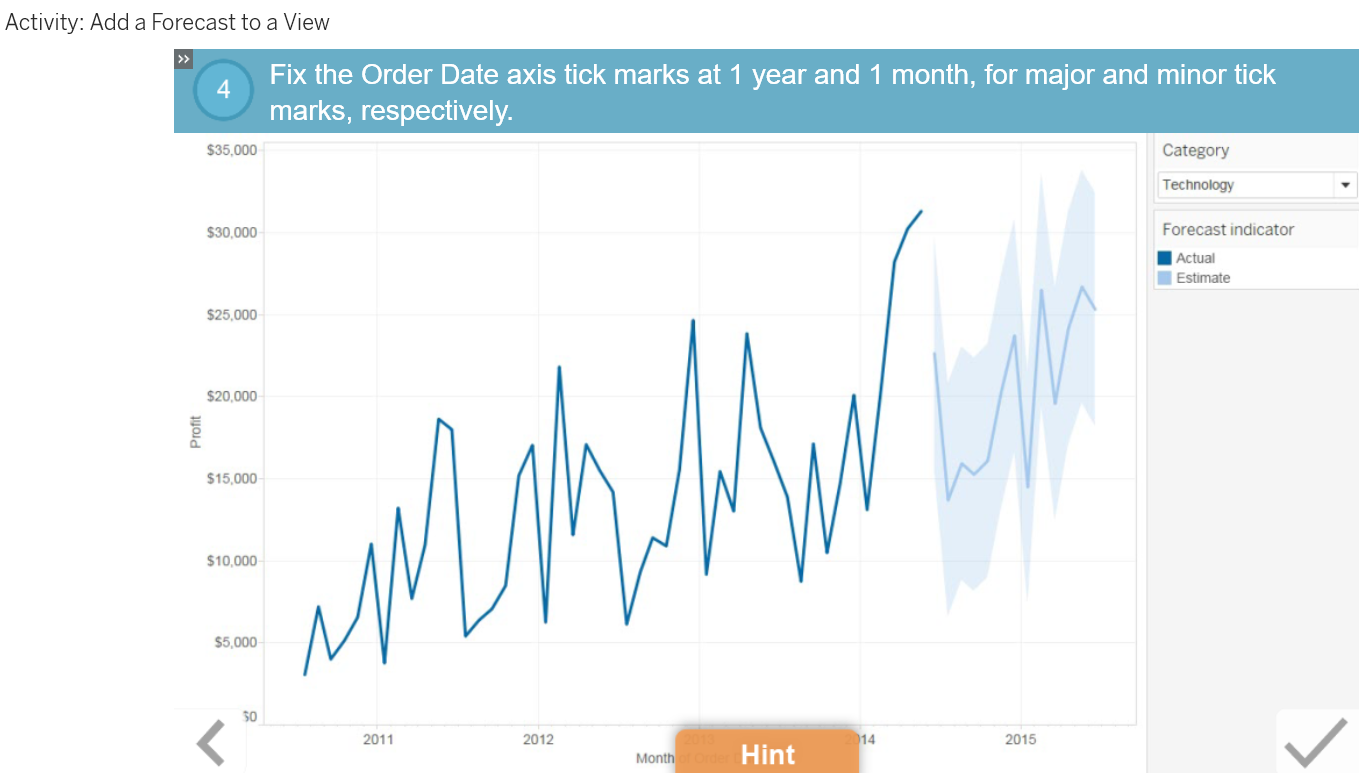
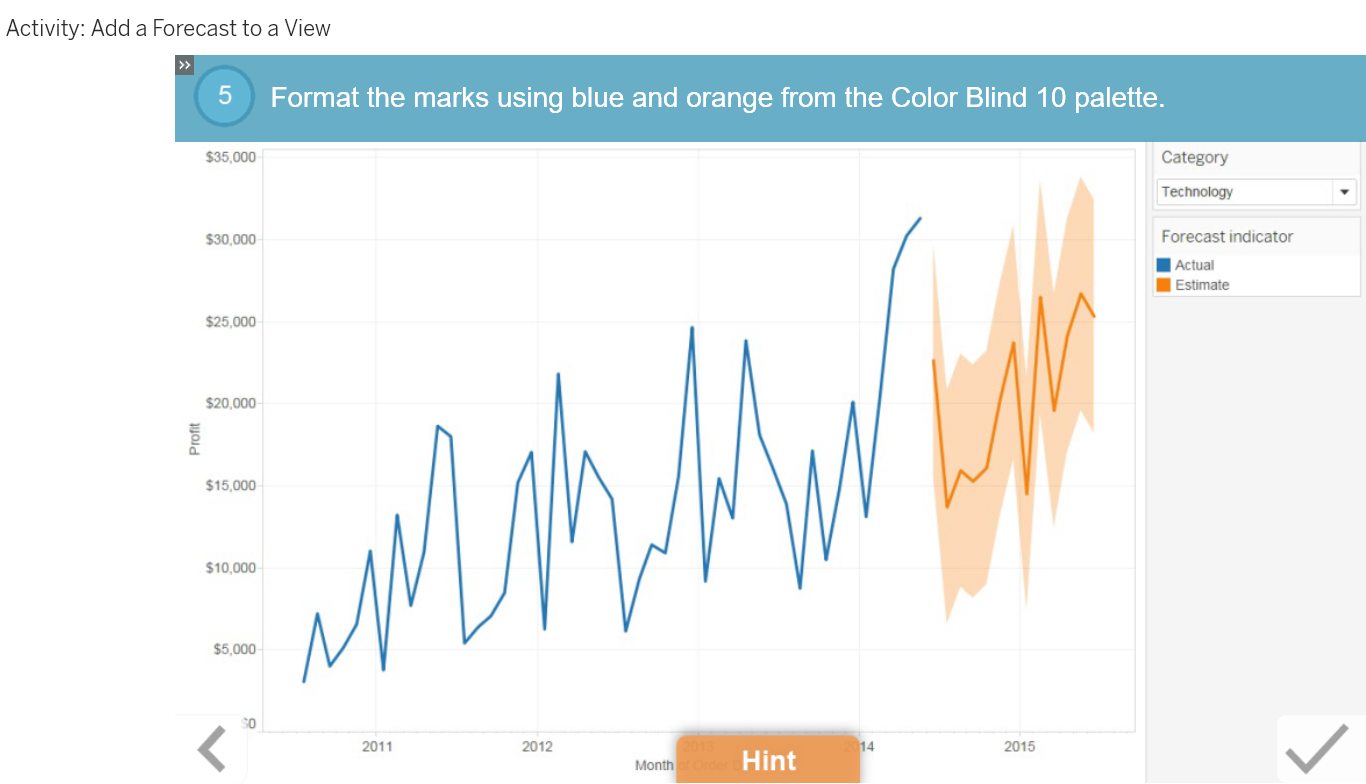
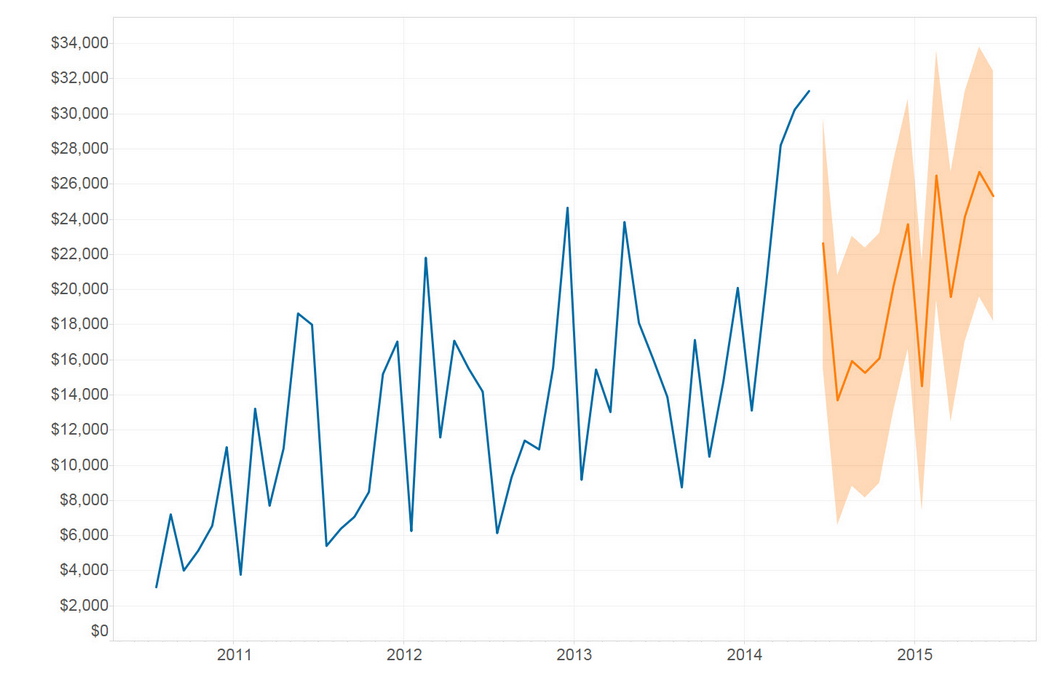
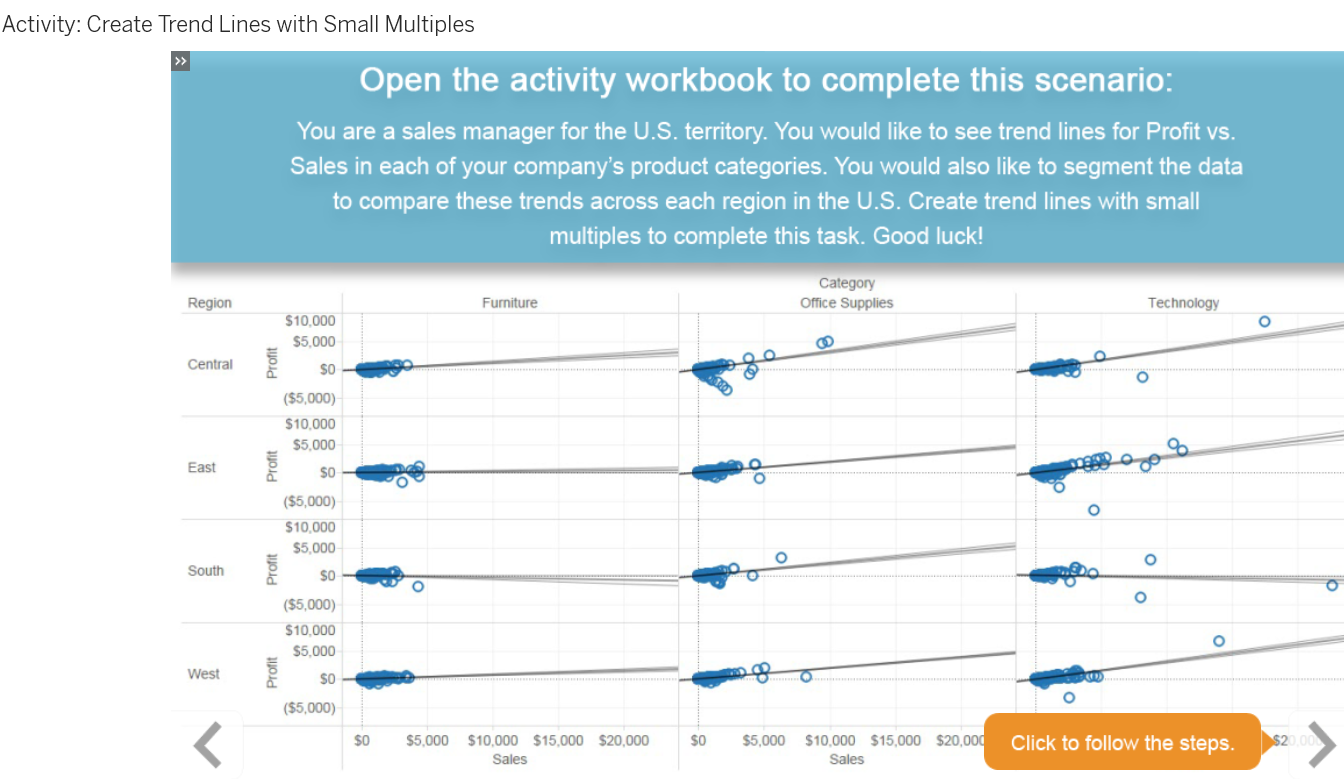
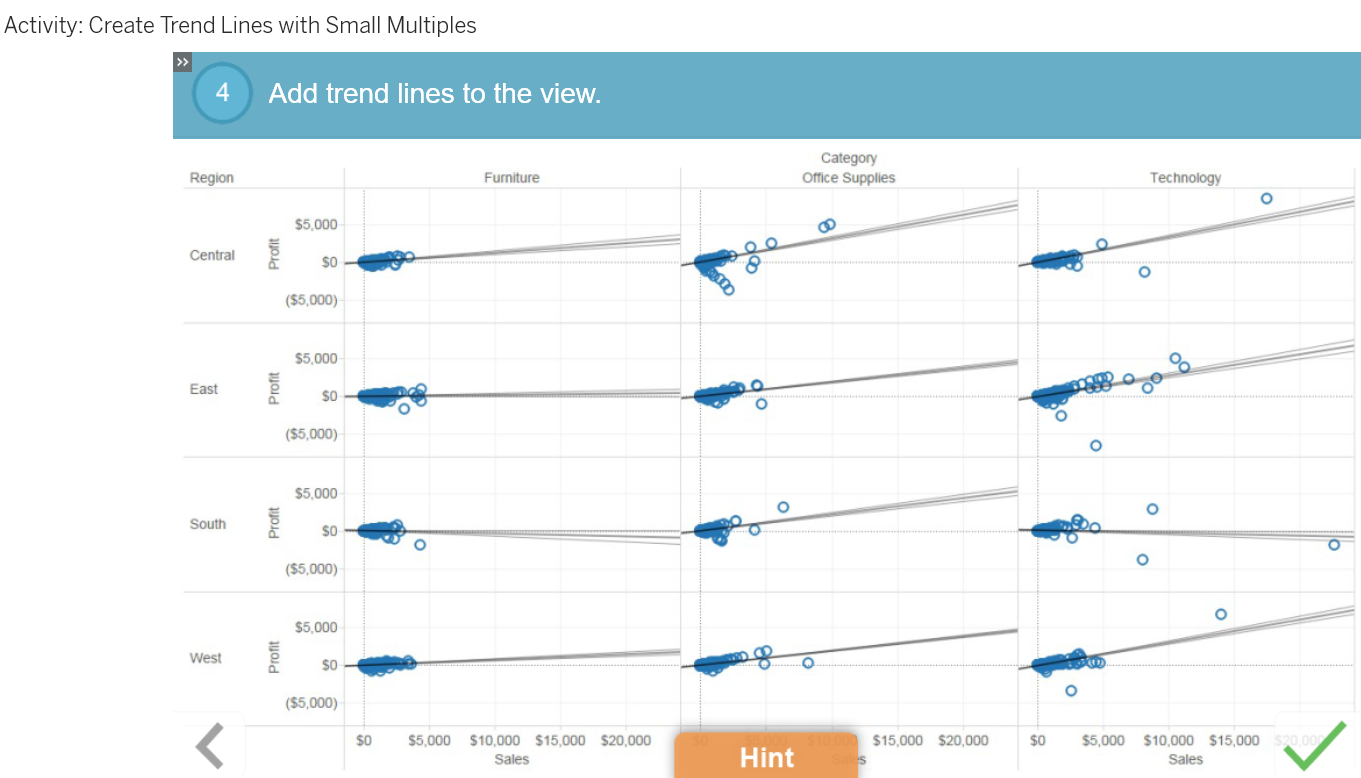
Make your visualizations more meaningful by adding trend lines or forecasting! Learn how to add trend lines and what they might mean for your data. Use forecasting to estimate future data trends and help your audience make better decisions.
Lesson Objectives
At the end of this lesson, you will be able to:
- Define and describe the purpose of a trend line.
- Add, remove, and edit a trend line.
- Identify trend line model types.
- Assess the significance of a trend line.
Lesson Objectives
At the end of this lesson, you will be able to:
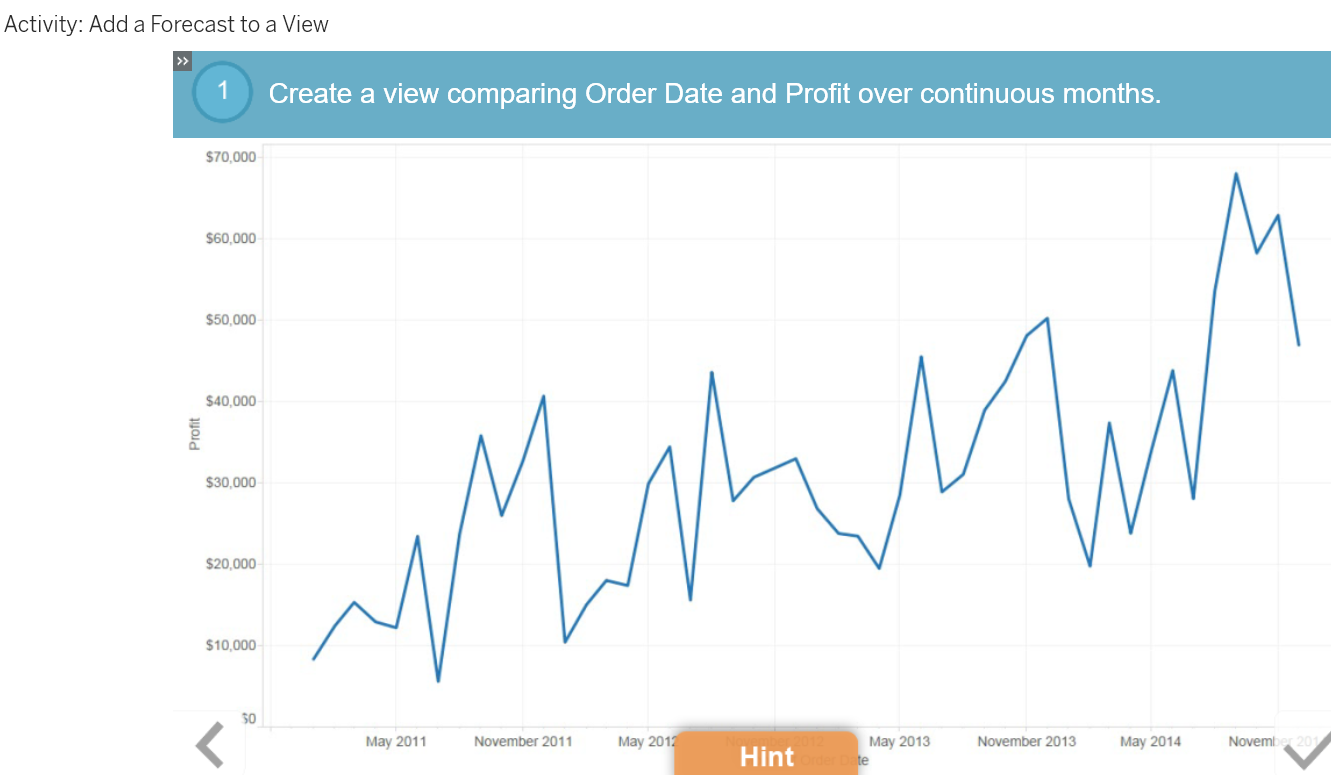
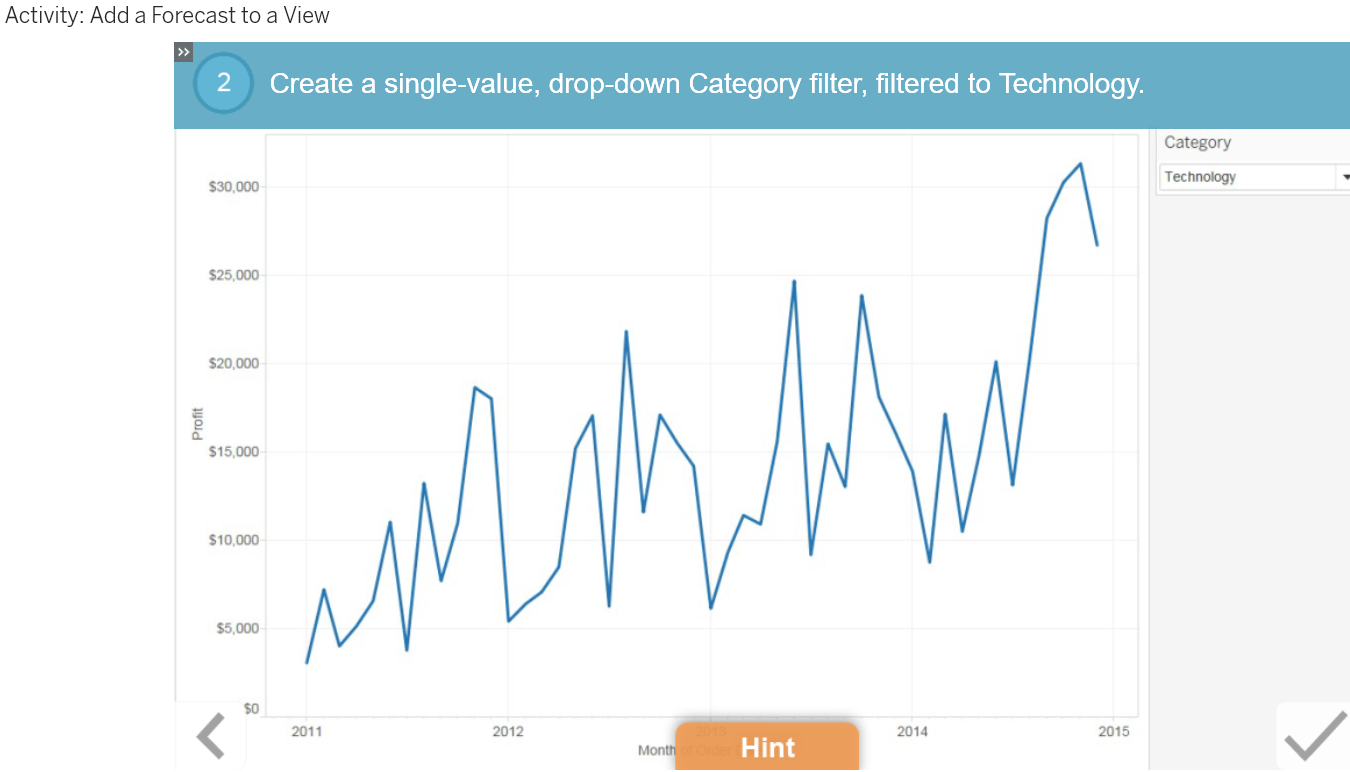
- Create a view using a continuous date.
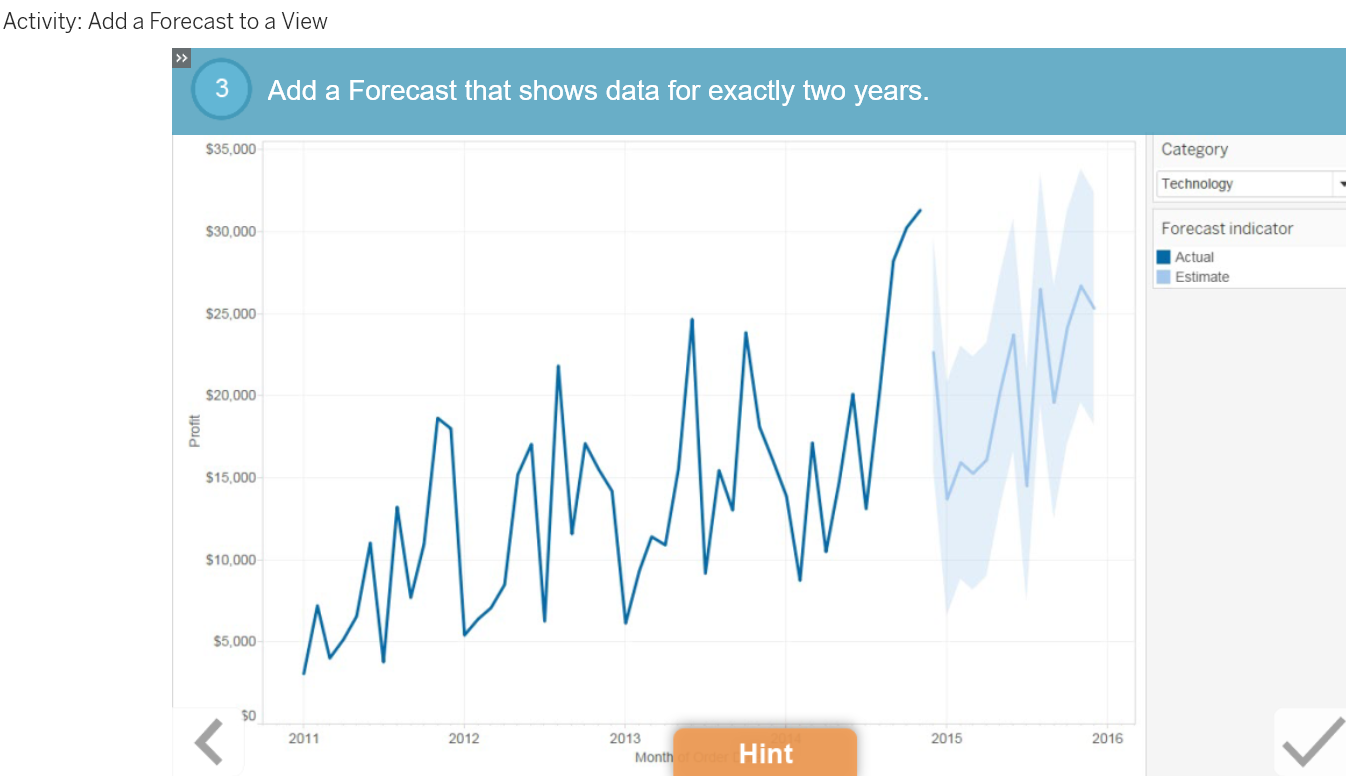
- Add a forecast to a view.
- Analyze a forecast.
