Viewing Distributions
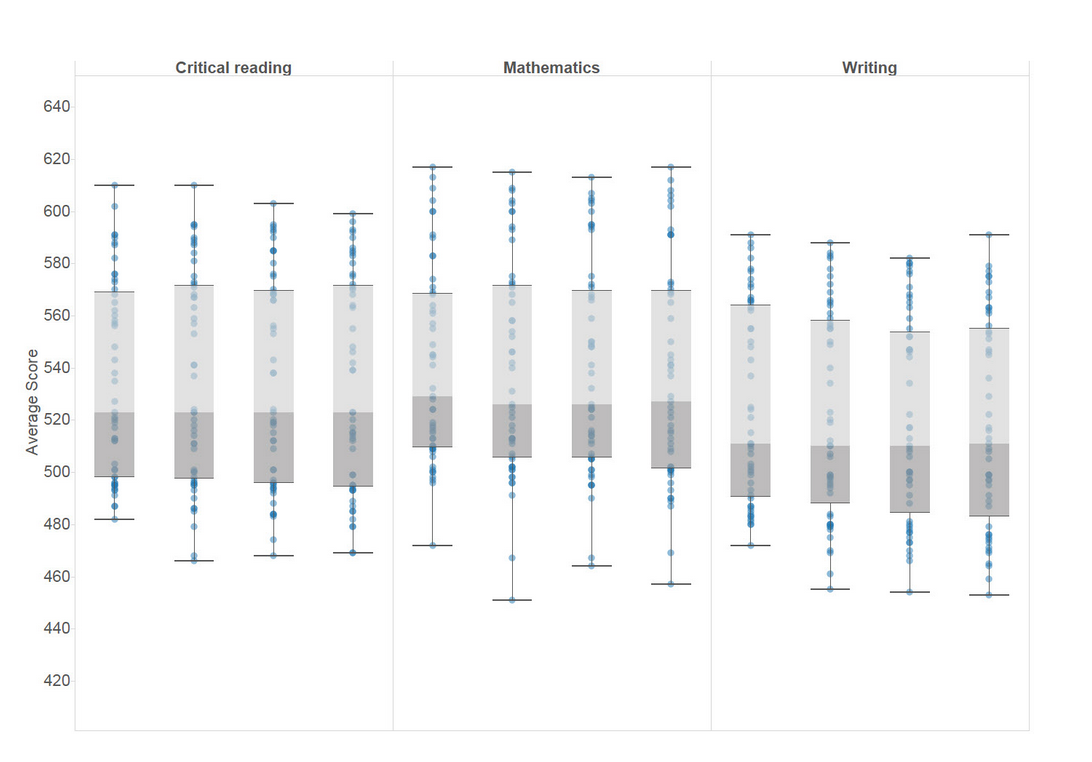
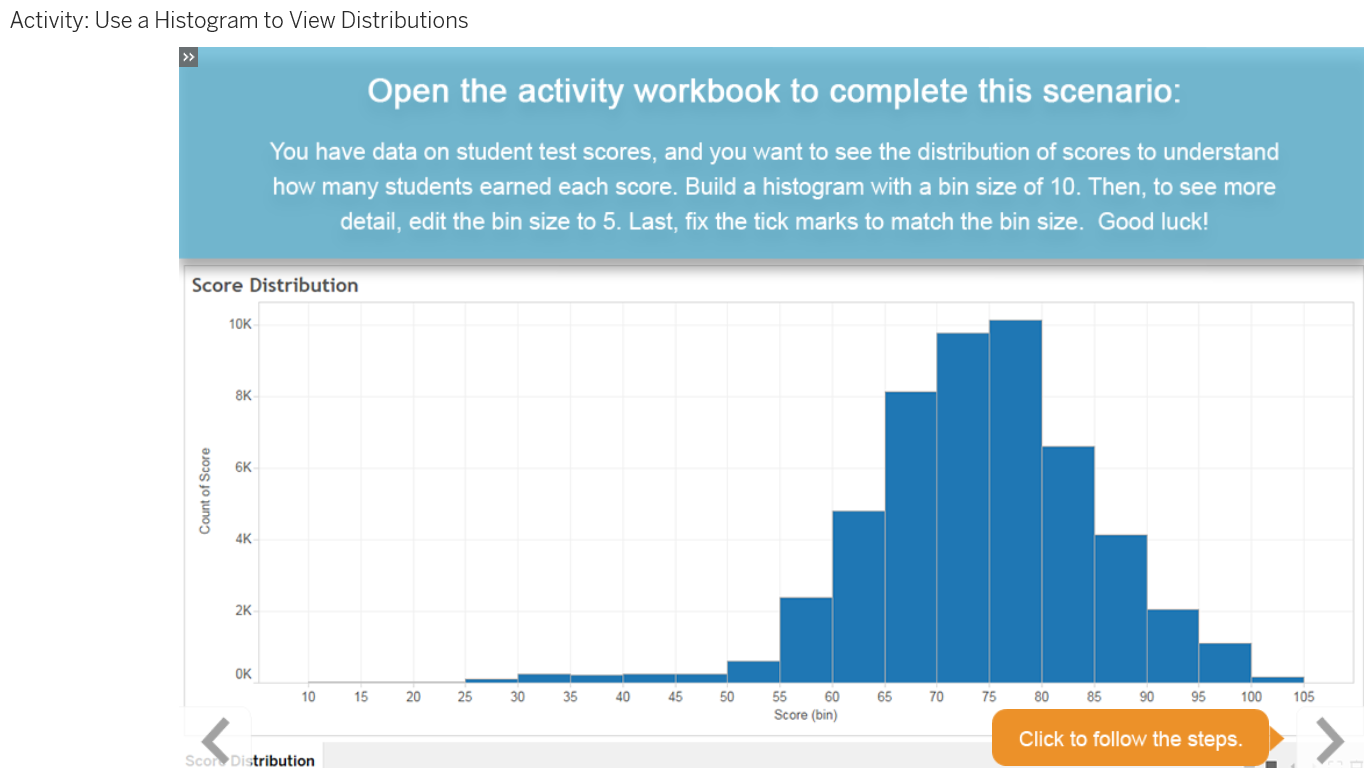
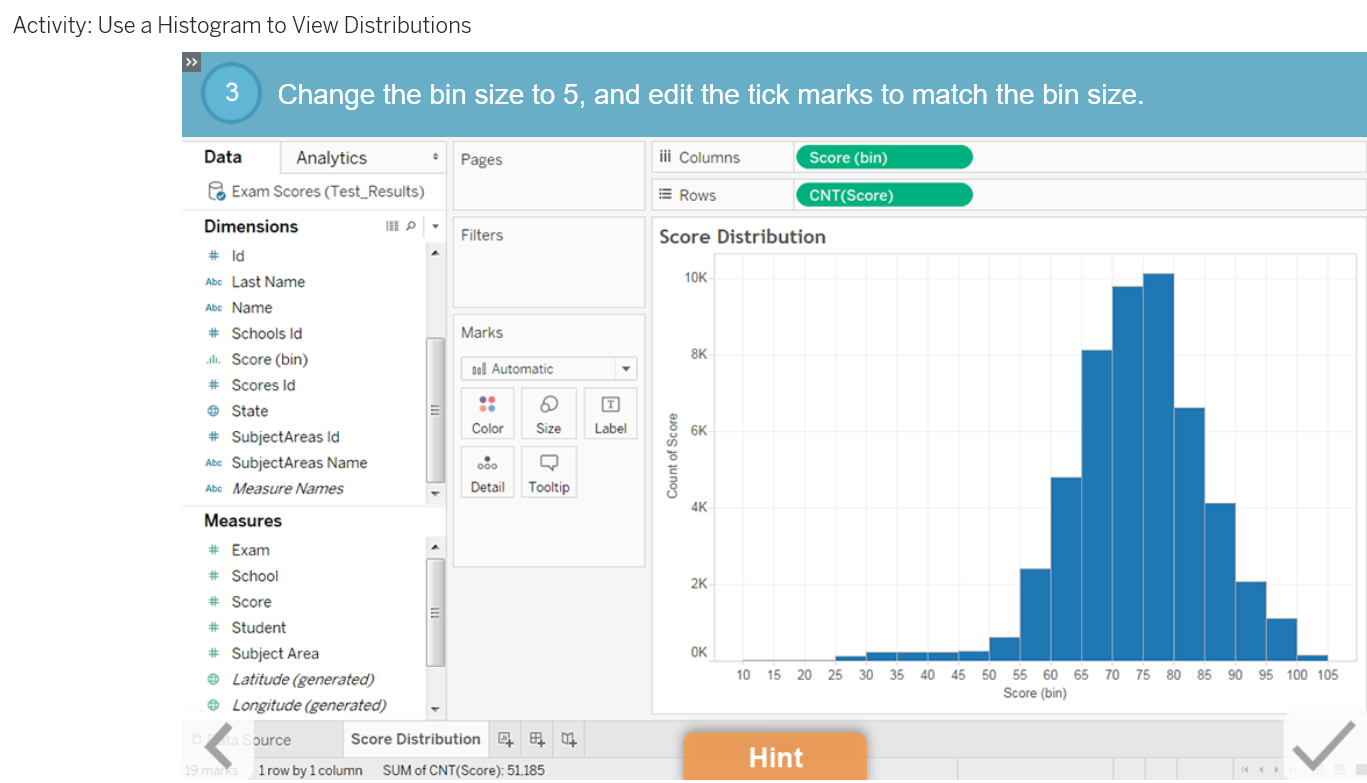
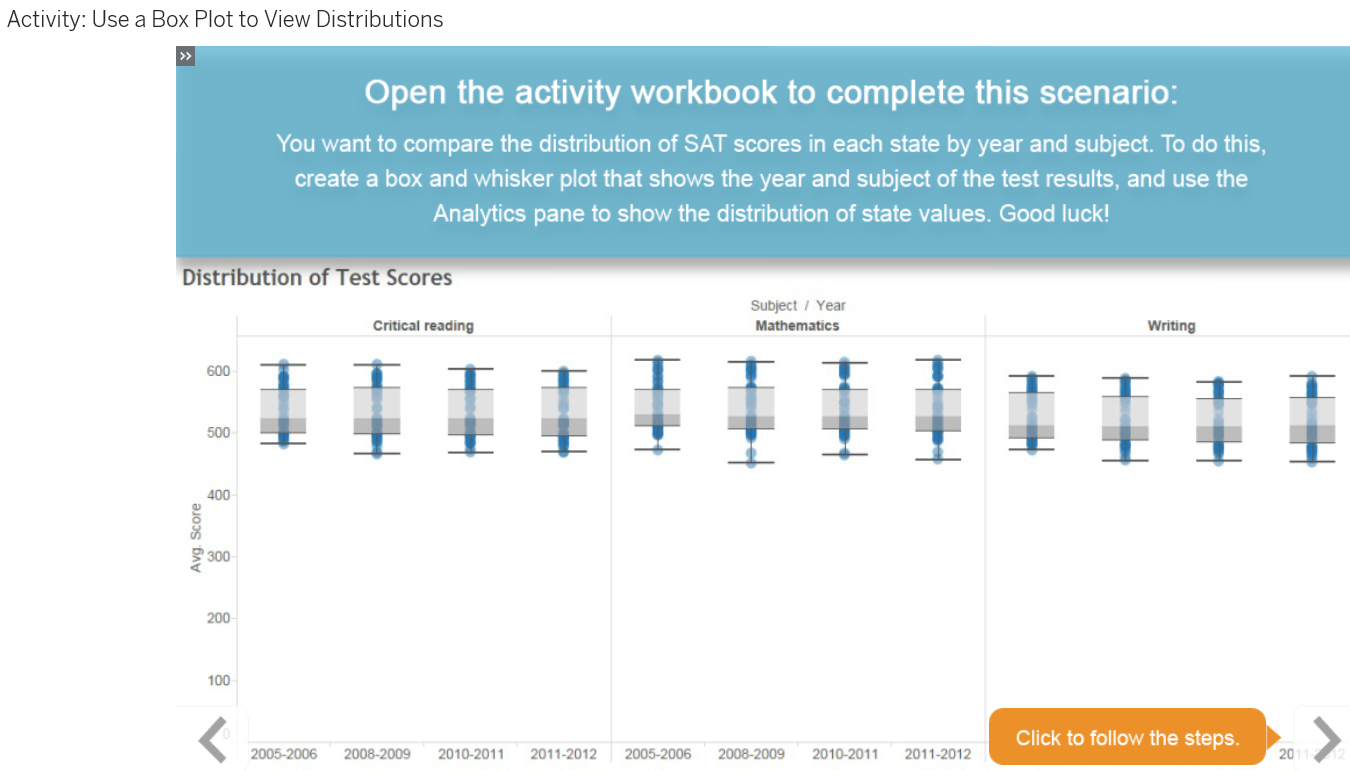
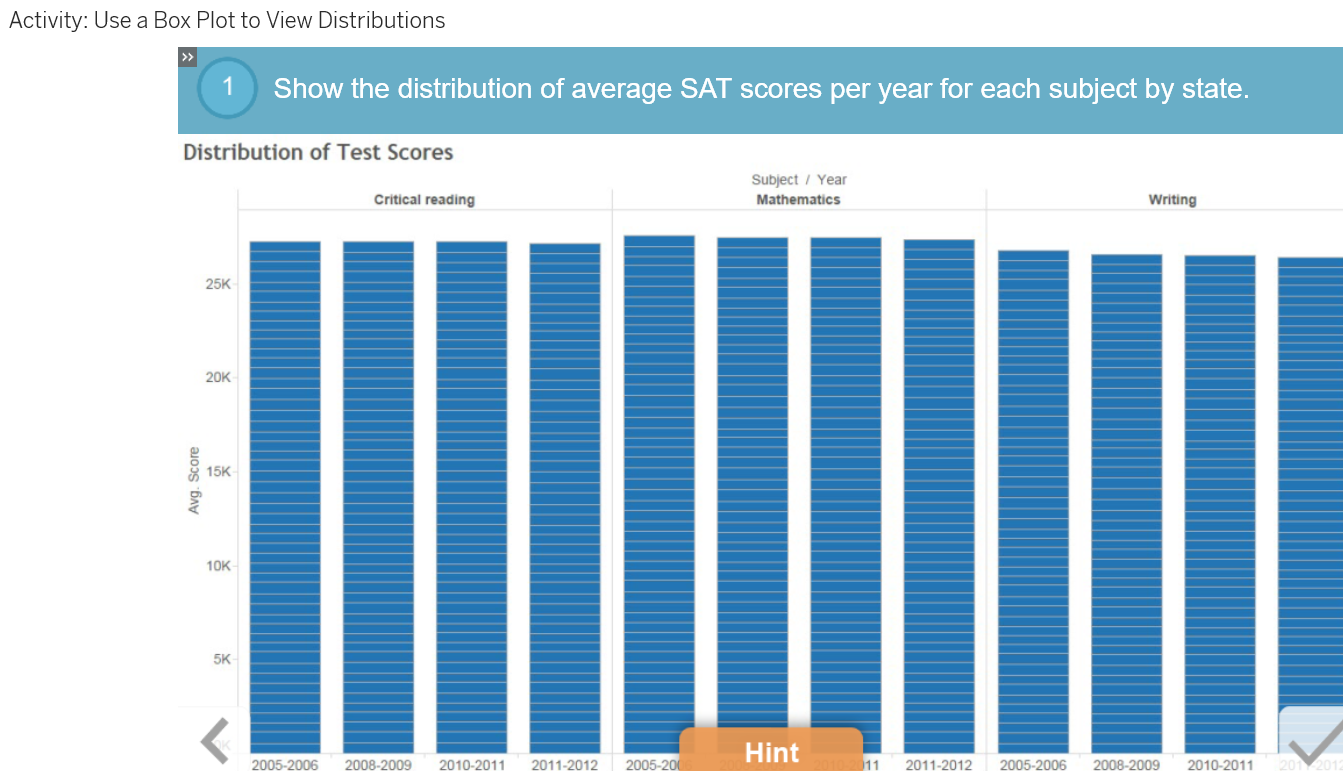
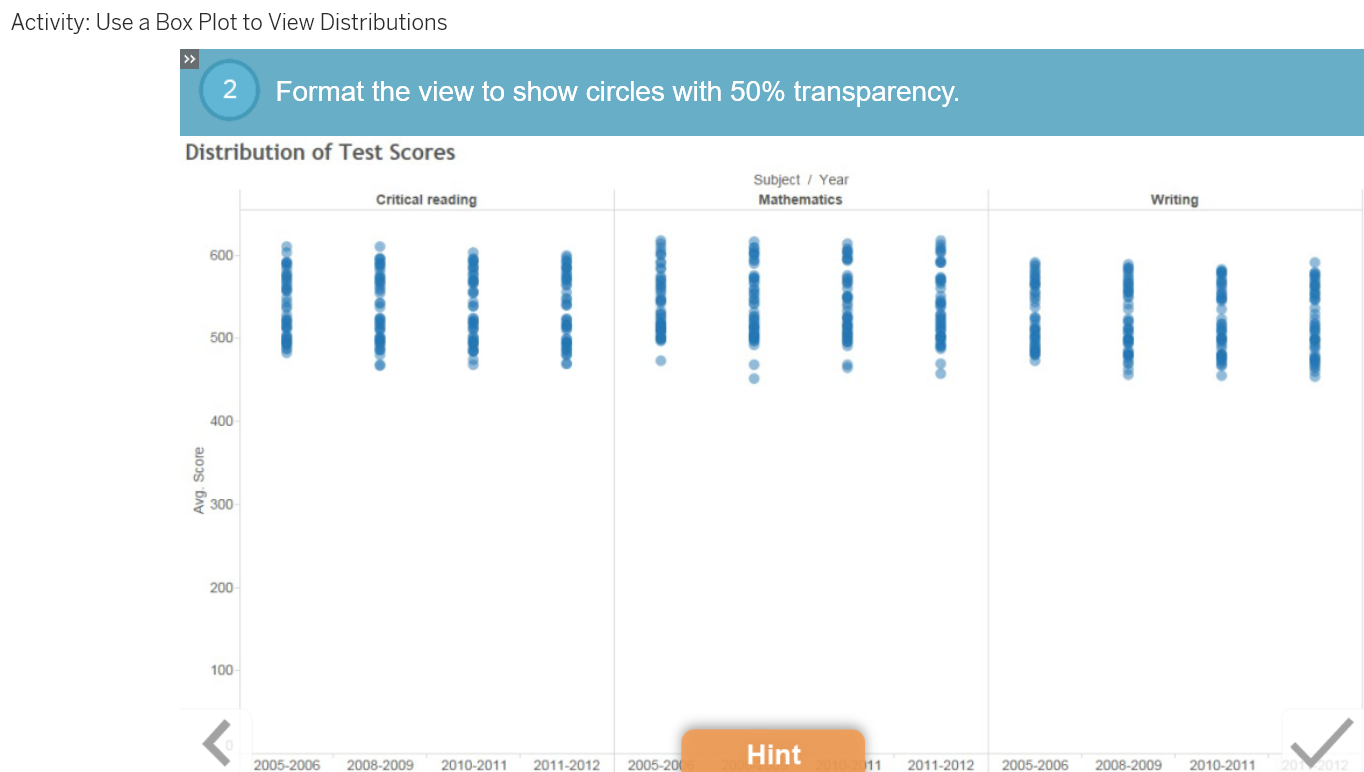
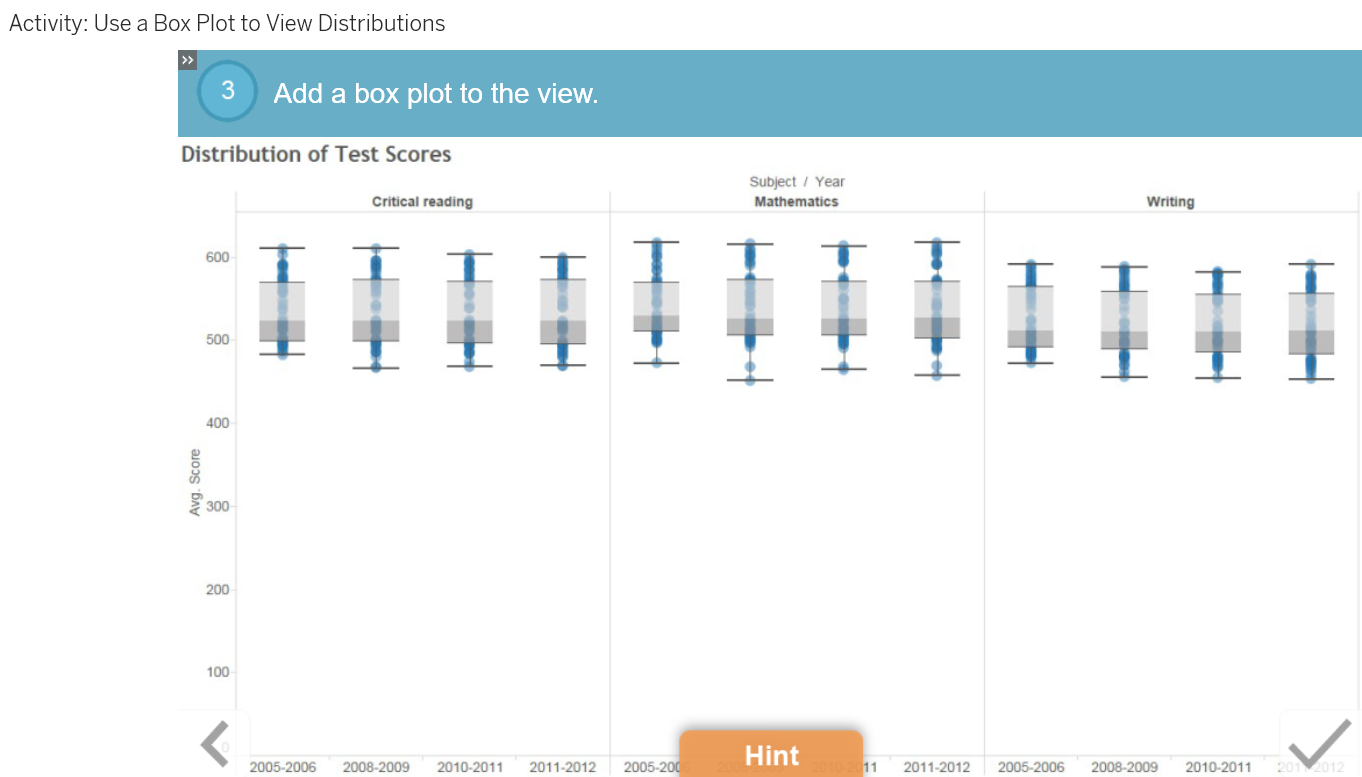
Seeing how your data is distributed can help you find places to dive deeper. Put data into bins and visualize them in a histogram. Learn how to build a box and whisker plot to show distributions of data.
Lesson Objectives
At the end of this lesson, you will be able to:
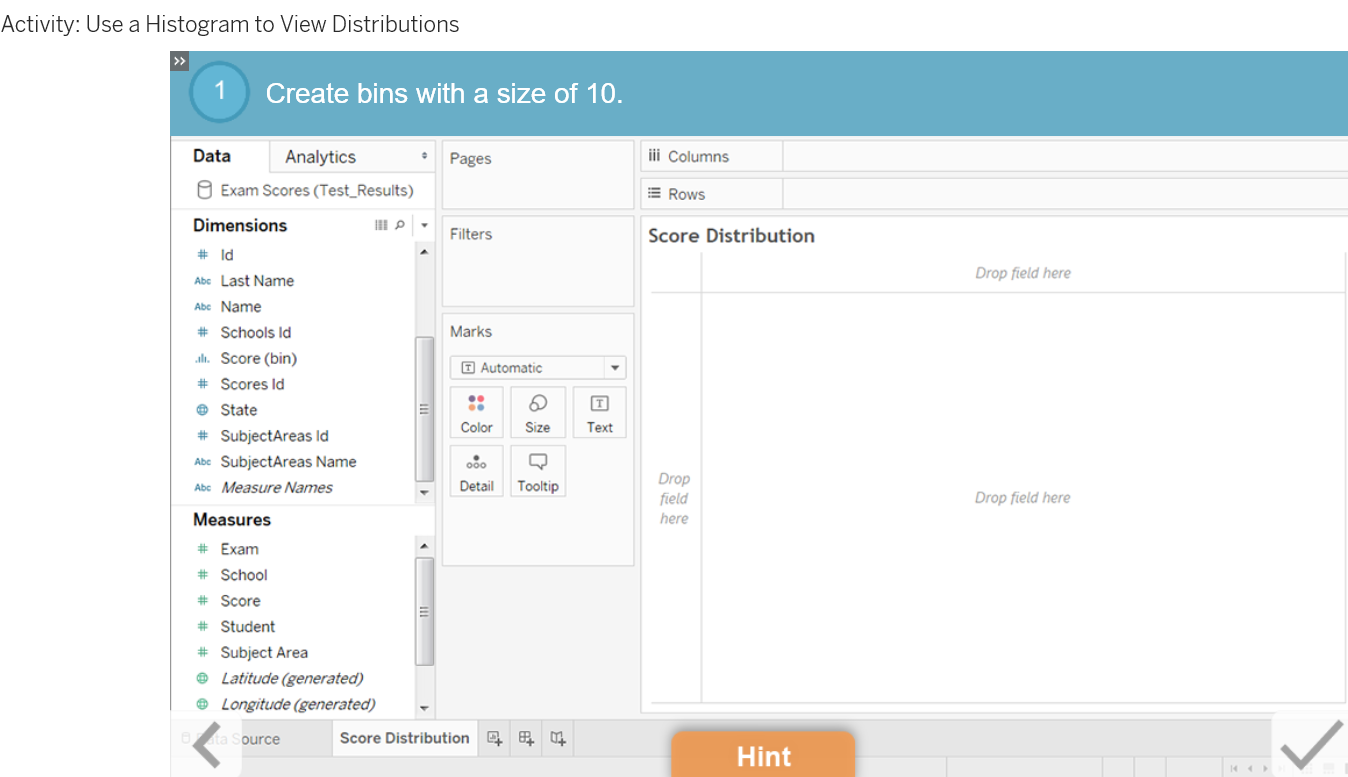
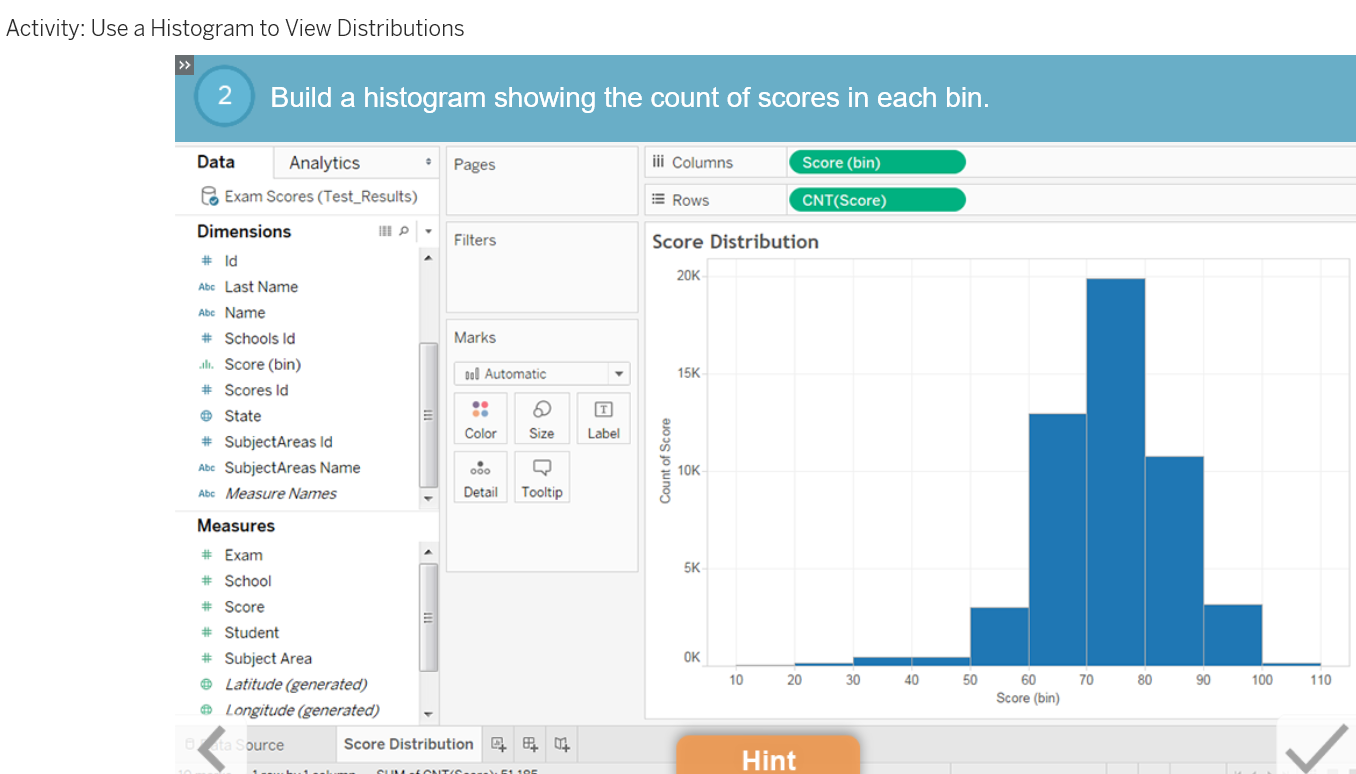
- Describe the function of bins in Tableau.
- Describe how to create a histogram in Tableau using bins.
Lesson Objectives
At the end of this lesson, you will be able to:
- Show how to create box and whisker plots from the Analytics pane.
- Describe the structure of a box and whisker plot.