Using Crosstabs: Heat Maps
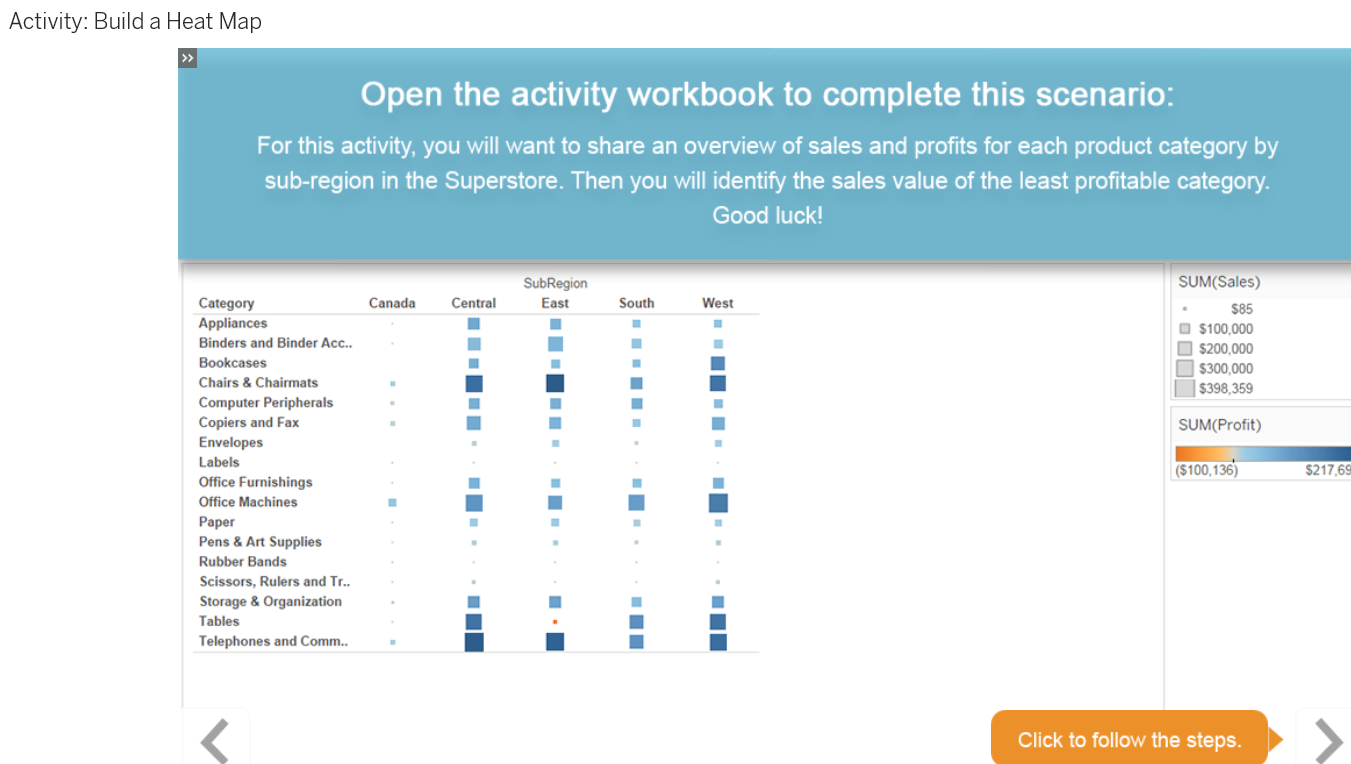
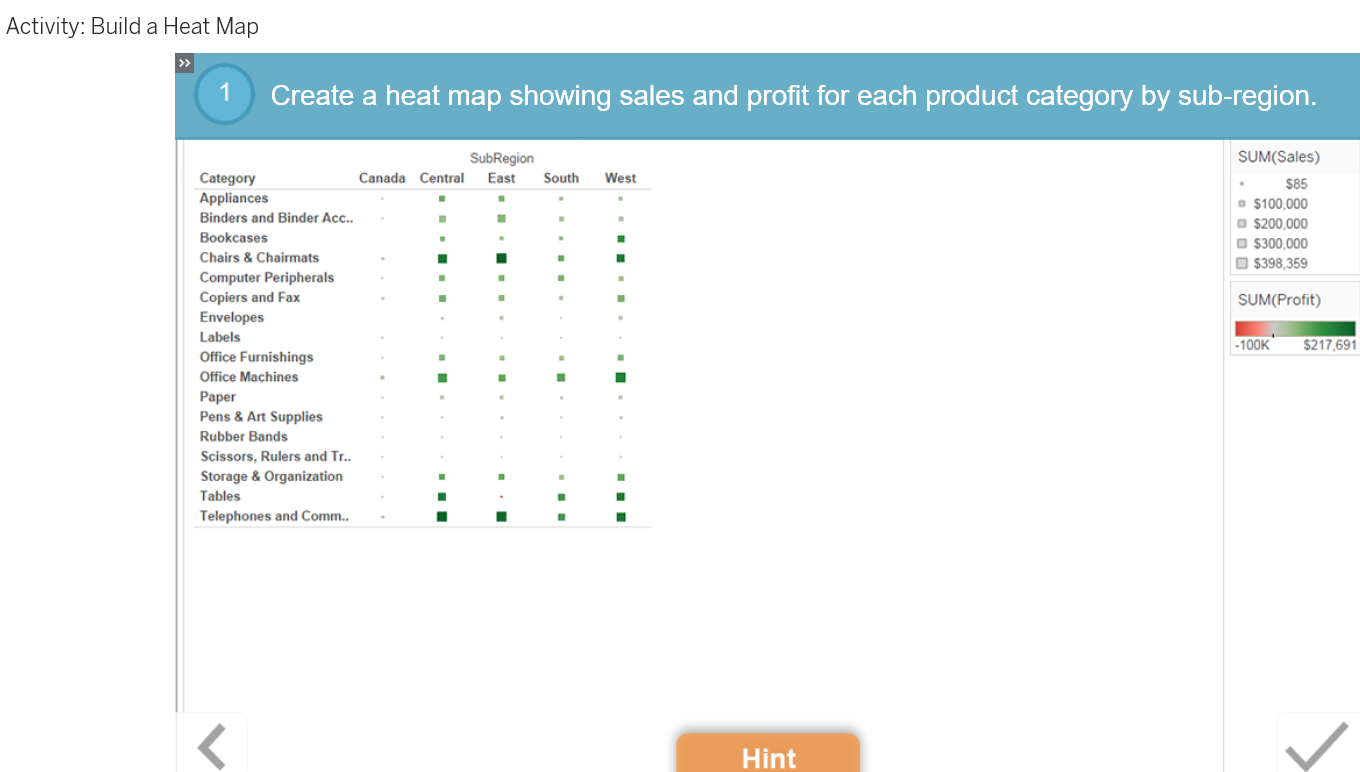
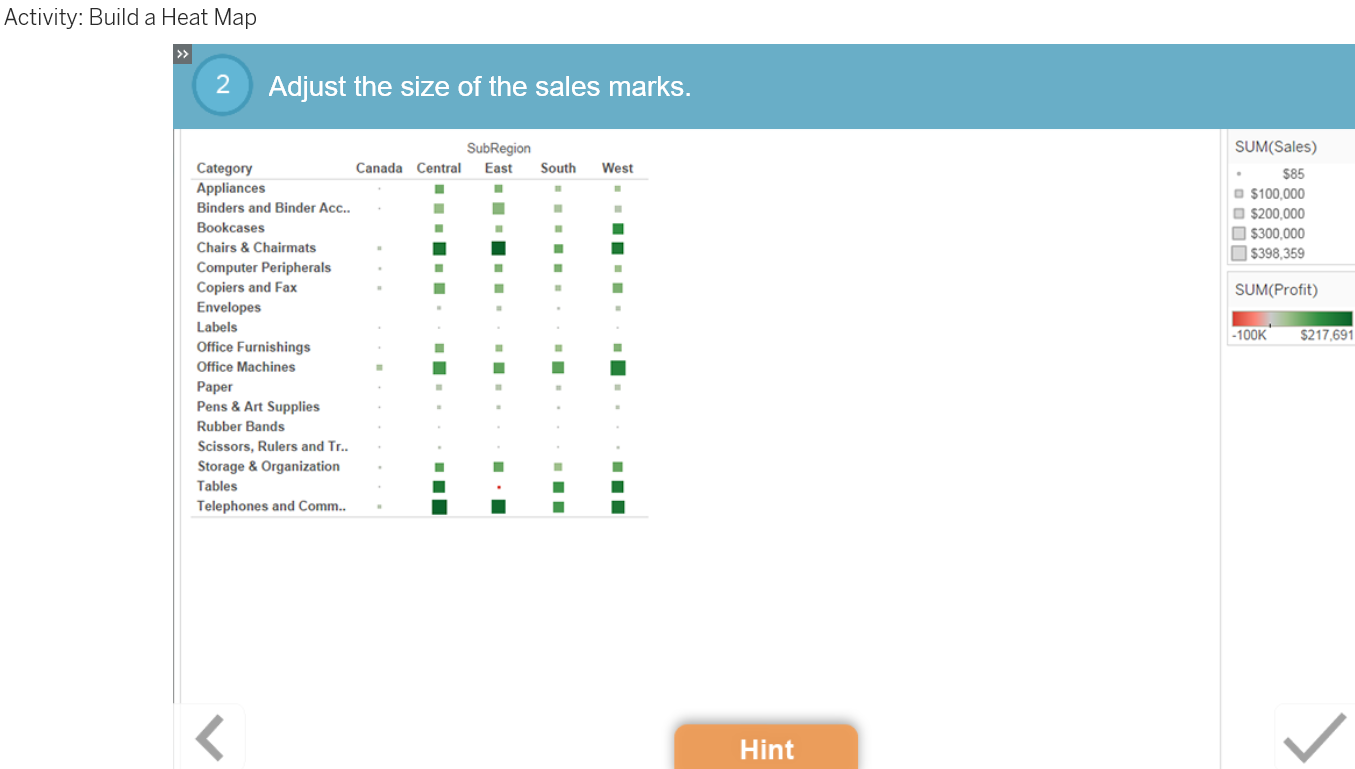
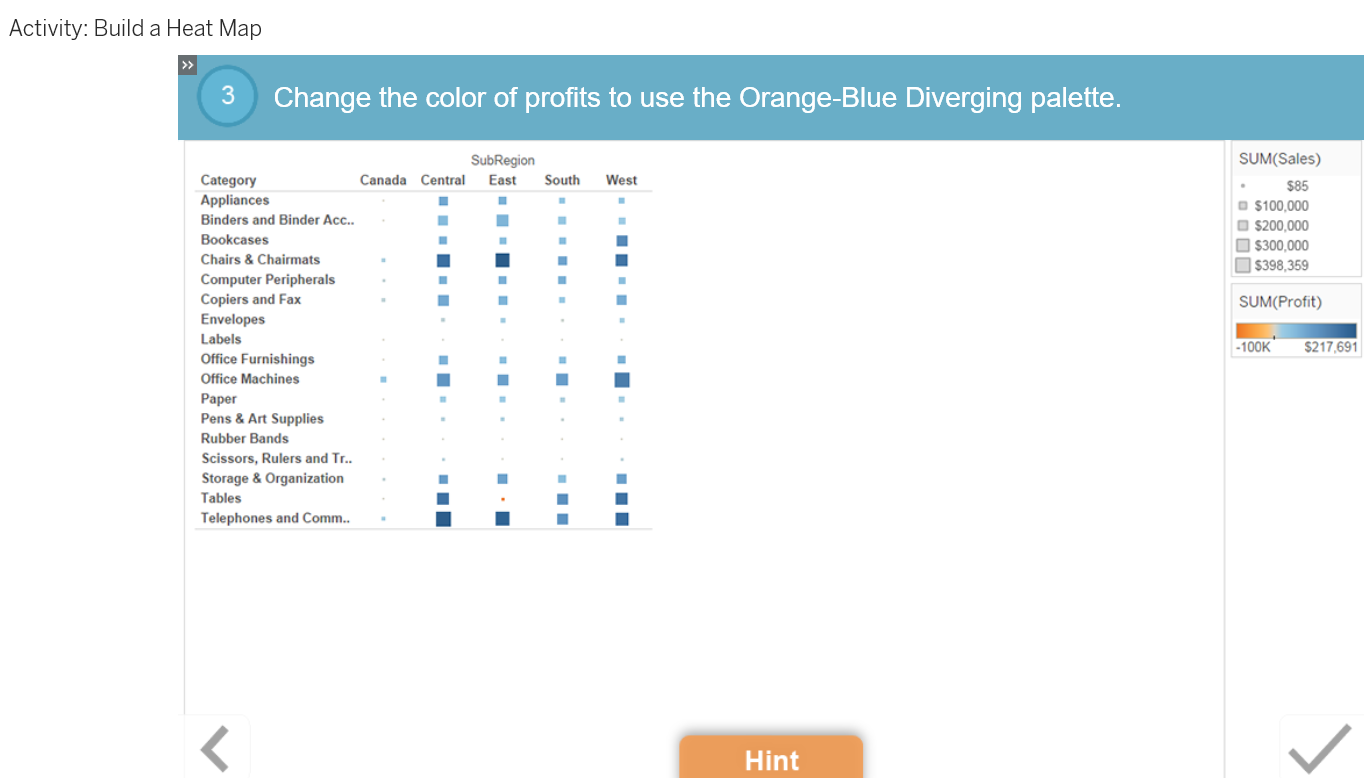
Seeing your measures visually through size and color can help give your data a focal point. Show these numeric values across multiple related dimensions to derive additional insight. In this module, you will learn how heat maps compare these measures to break down your data and show outliers within your dimension comparisons.
Lesson Objectives
At the end of this lesson, you will be able to:
- Build a heat map.
- Interpret data displayed on a heat map.


