Direkt zum Inhalt
Startseite
Data-Driven-Decision-Making

Hauptnavigation

  • Startseite
  • Wozu Daten-getrieben?
  • Tableau Blueprint
  • Training
  • Daten Visualisierung
  • BI-Themen

Using Crosstabs: Highlight Tables

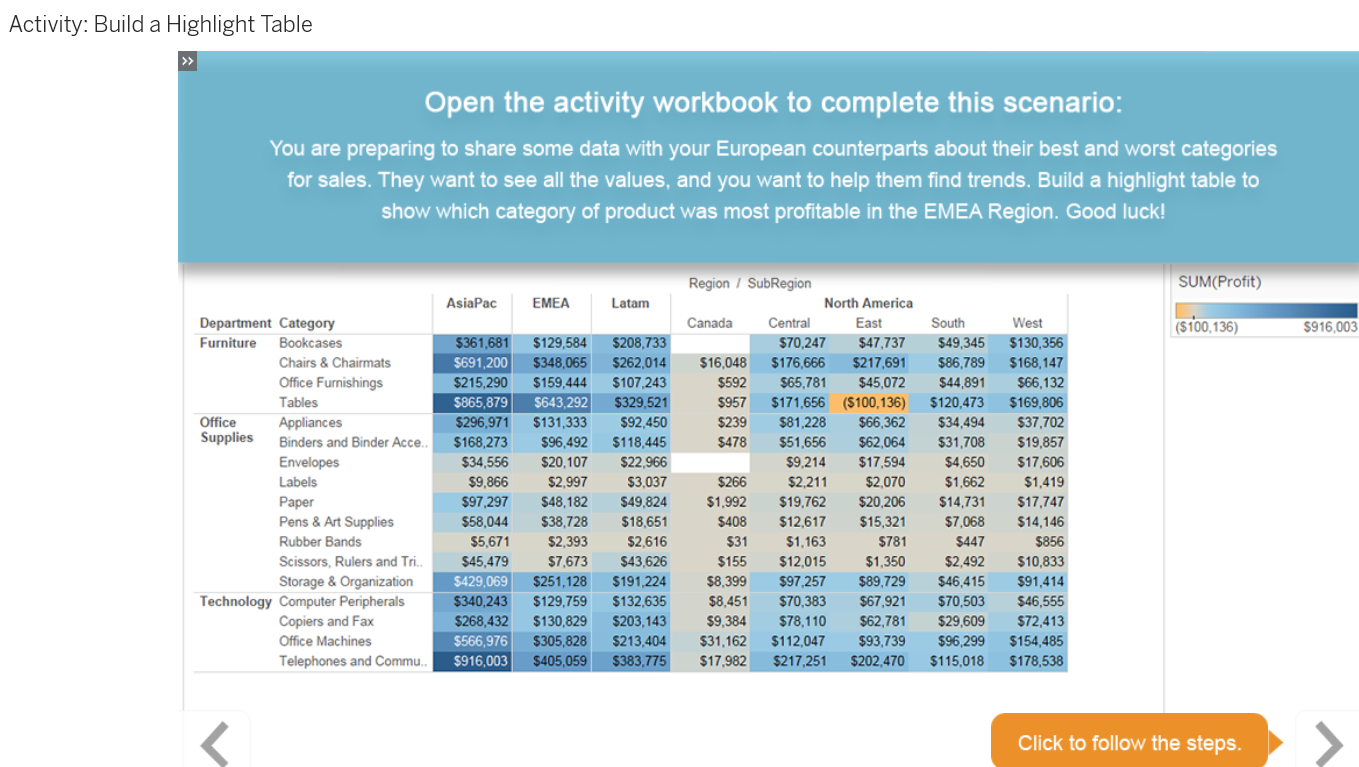
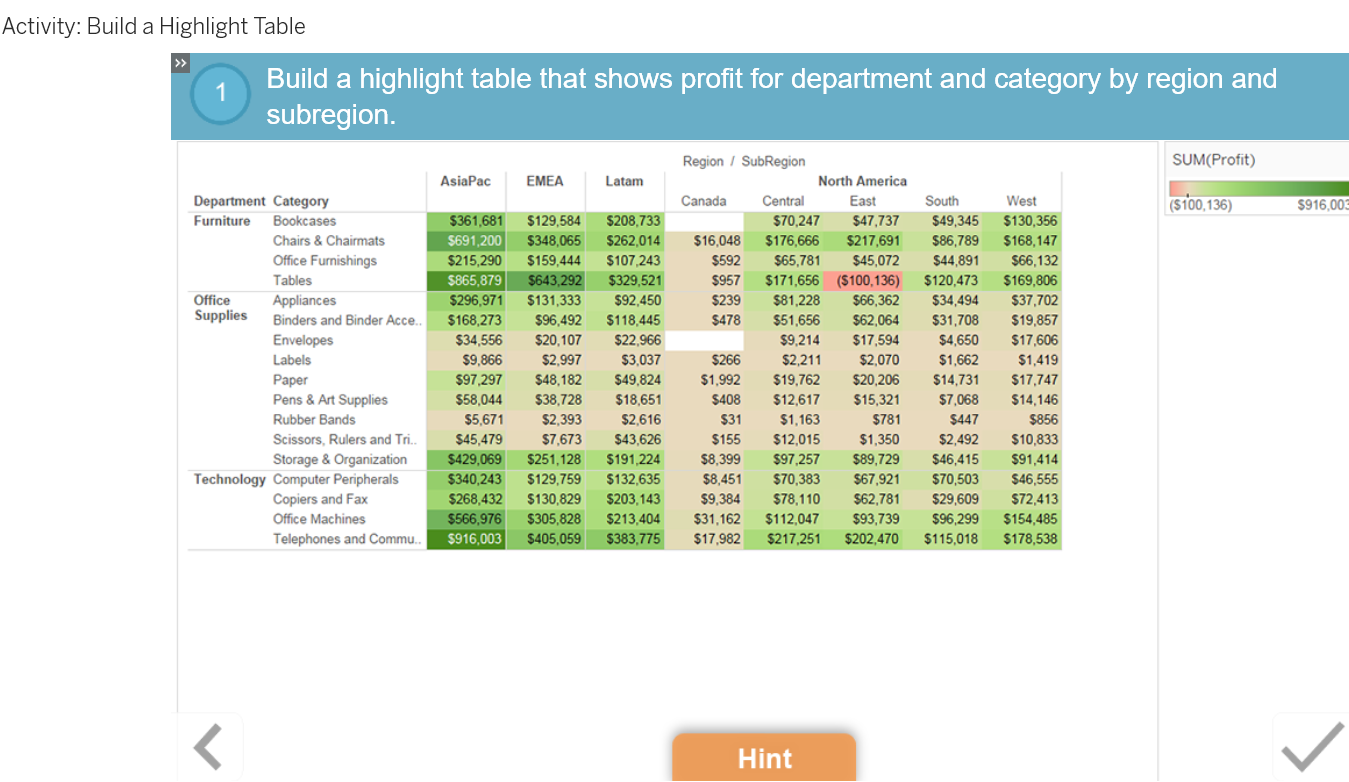
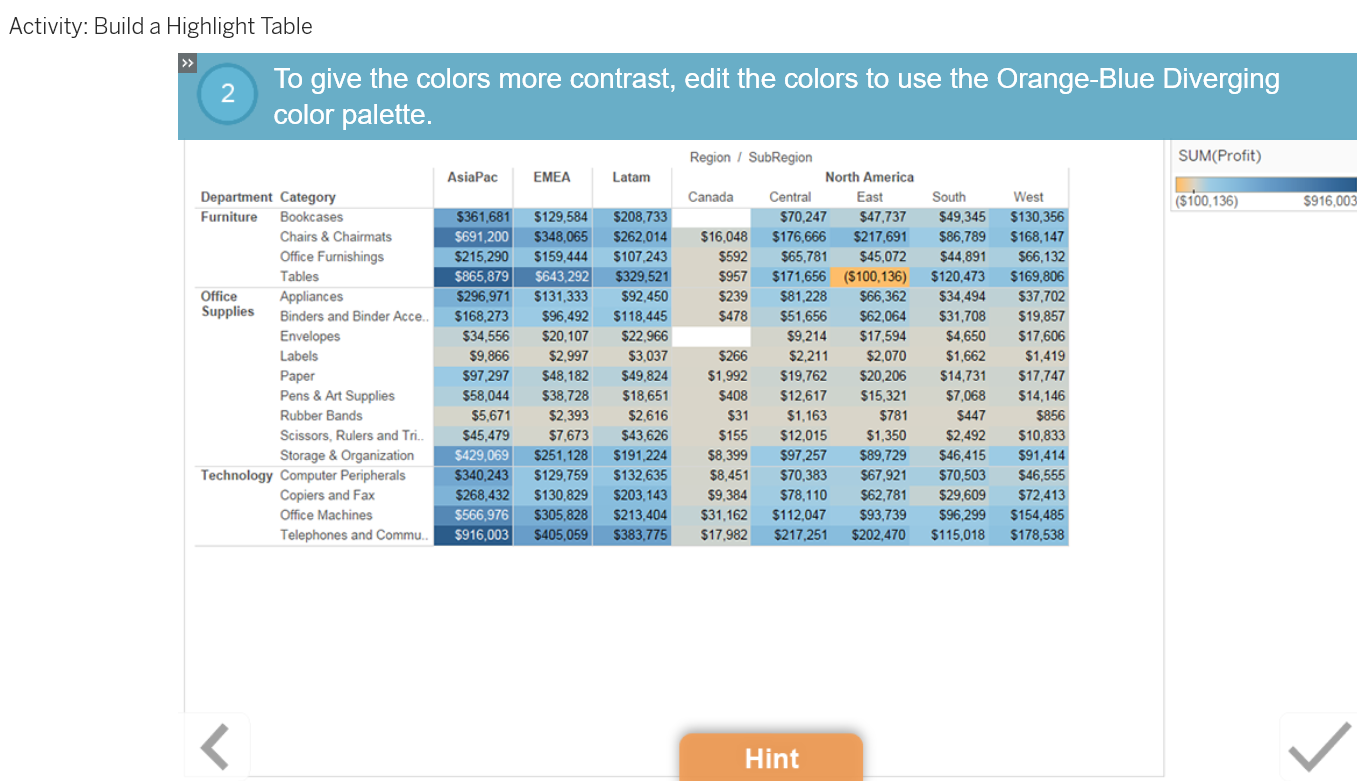
Put a spotlight on outliers. Create a highlight table using a crosstab and color encoding to make outliers visually stand out.

Lesson Objectives

At the end of this lesson, you will be able to:

  • Build a highlight table.

t

t

t

Links für das Blättern im Buch Using Crosstabs: Highlight Tables

  • ‹ Using Crosstabs: Totals and Aggregation
  • Nach oben
  • Using Crosstabs: Heat Maps ›

Fußzeilenmenü

  • Kontakt

Copyright 2024