Cleaning and Preparing Data
According to the Harvard Business Review, many analysts spend 80% of their time prepping data and only 20% of their time analyzing it. Cleaning and preparation include the processes used to enhance, refine, or prepare raw data for analysis. As a data steward, you may use a variety of tools for data preparation including Tableau Desktop and Tableau Prep products.
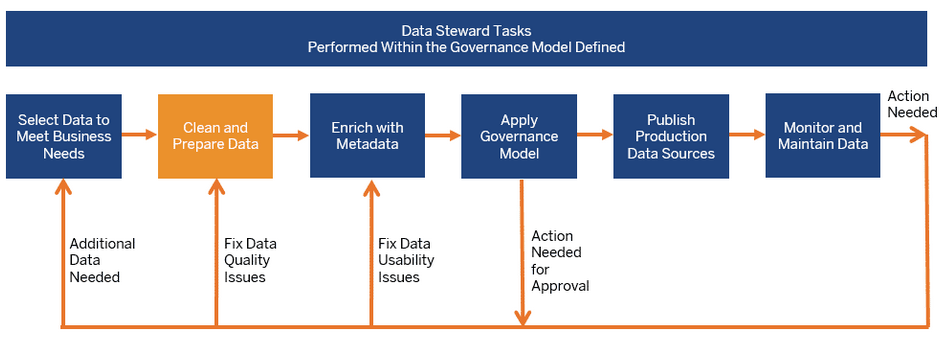
A glance at the workflow
Now that you have selected the data that will meet the business needs, you are ready to clean and prepare it according to the quality standards that have been defined. Data preparation includes reshaping the data structure and combining data.
Determine data preparation needs
What are some solutions to address common data prep barriers?
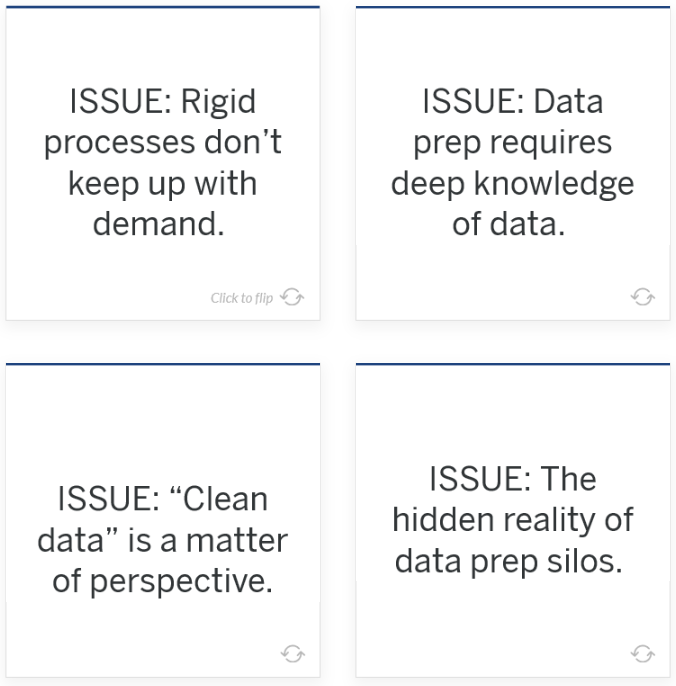
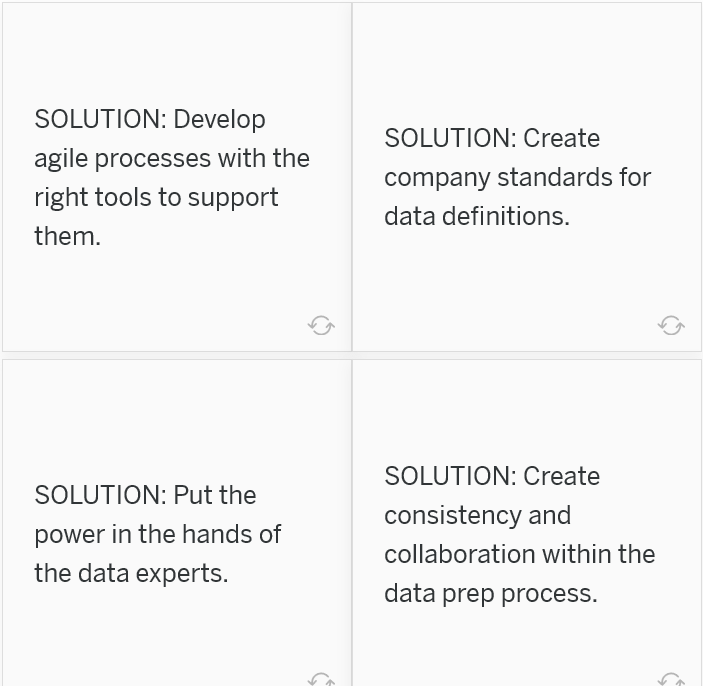
"Dirty" data, meaning data that is poorly structured, full of inaccuracies, or incomplete, leads to inefficient ad-hoc analyses and declining trust in organizational data. To learn about why dirty data happens and how to address it, read the white paper below. It outlines four common data preparation issues and how to solve them.
Tools for cleaning and preparing data
Depending on the flexibility defined in the chosen governance model processes for cleaning and preparing data, you may have a variety of tools available to perform the work. Note that these options can be combined.
Self-service data preparation using Tableau
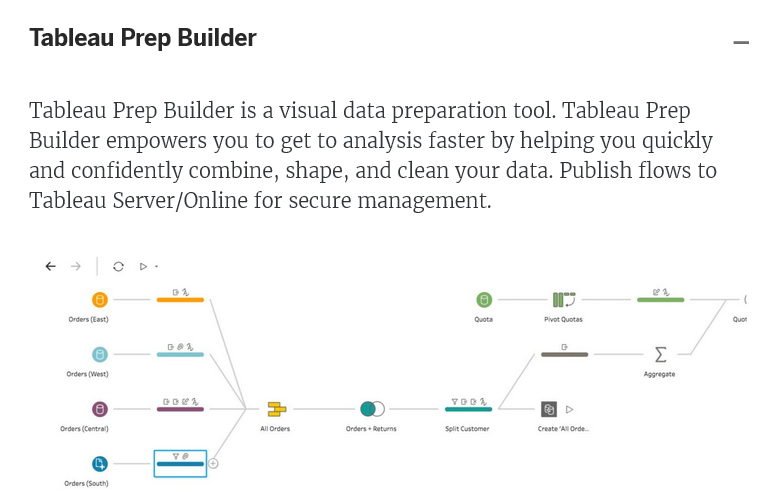
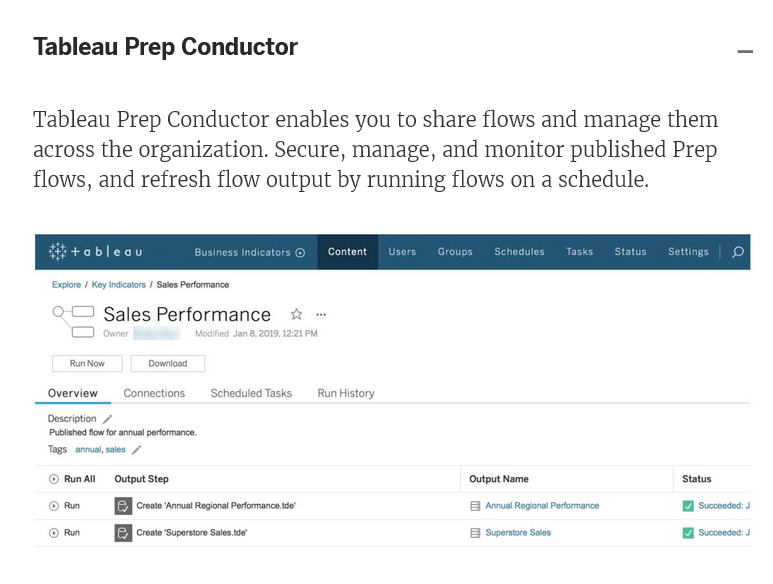
Use Tableau Desktop or Tableau Server/Online for data preparation. Or, for shareable, repeatable self-service data preparation, use Tableau Prep Builder and Tableau Prep Conductor to clean, shape, and combine multiple sources of data on a schedule. Tableau Prep Builder is part of the Tableau Creator license, while Tableau Prep Conductor is part of the Tableau Data Management Add-On.
 |
 |
Depending on the flexibility defined in the chosen governance model processes for cleaning and preparing data, you may have a variety of tools available to perform the work. Note that these options can be combined.
Self-service data preparation using Tableau
Use Tableau Desktop or Tableau Server/Online for data preparation. Or, for shareable, repeatable self-service data preparation, use Tableau Prep Builder and Tableau Prep Conductor to clean, shape, and combine multiple sources of data on a schedule. Tableau Prep Builder is part of the Tableau Creator license, while Tableau Prep Conductor is part of the Tableau Data Management Add-On.
Other data prep options
Depending on the governance model implementation plan and tools/time available and your skills and experience, you may choose to use other options or a combination of options to clean and prepare your data. Some options are listed below. Request changes to clean and prepare your data in the underlying database itself.
Use custom SQL to combine, restructure, or reduce the size of your data for analysis, etc.
Use programming languages such as R or Python to clean and prepare data. Note that custom scripts can also be executed within Prep Builder.
Custom SQL
Use custom SQL to combine, restructure, or reduce the size of your data for analysis, etc.
Use programming languages such as R or Python to clean and prepare data. Note that custom scripts can also be executed within Prep Builder.
Other ETL tools
ETL tools are a complex but powerful way to clean and prepare data. Use command-line interfaces and APIs to integrate Tableau with your existing ETL processes.
Common data preparation needs
Factors like human error, disparate systems, and changing business requirements can contribute to dirty data, but data prep often necessitates more than simple cleaning steps. Users may need to adjust the granularity of the data or transform it to align and then union or join with other data. This means the data ready for analysis often looks very different from the original data source.
Building on the work you did when selecting the data, use the business needs, quality standards, and governance model to determine what cleaning, shaping, and combining is needed. Consider the audience for the cleaned and prepared data in order to determine the data structure. Keep in mind how people will use the data for analysis and what type of questions need answering.
Determine the structure of data needed for analysis and how to achieve it
Often, a single data source does not answer all the questions a user may have. Adding data from different sources gives valuable context. Tableau Desktop and Tableau Prep Builder allow you to join tables from different vendors and databases, then publish them as a new single Tableau data source for others to find and reuse. To change the shape of a data structure for analysis or to combine with other data sources, use one of the shaping/reshaping options.
Joins
Use a join to combine data related by common fields. By adding more fields to your data source, you expand the number of fields users have for analysis.
Unions
Use a union to combine data by appending rows of one table to another table. The data source will keep the same table structure while adding more rows.
Blends
Use a blend to combine data that supplements a table of data from one data source with columns of data from another data source. Blends are helpful when the data is at different levels of detail/granularity. Blends are performed in memory during analysis, so they are not considered part of the data preparation process.
Pivots
Use a pivot to reshape data by restructuring your data from rows to columns. Tableau analysis works best with data in a "tall/narrow" or denormalized table structure, and pivots reshape data from a crosstab format into a columnar format, turning columns into rows.
Aggregates
Use an aggregate to adjust the level of detail/granularity of your data. Common use cases include wanting to reduce the amount of data output or wanting to combine with data at a different granularity. Aggregates are performed in Tableau Prep Builder.
Get started with Tableau Prep Builder
Tableau Prep Builder overview
Have you downloaded a trial version of Tableau Prep Builder? Are you cleaning data in Tableau Prep Builder for the first time? Do you want to know how to begin?
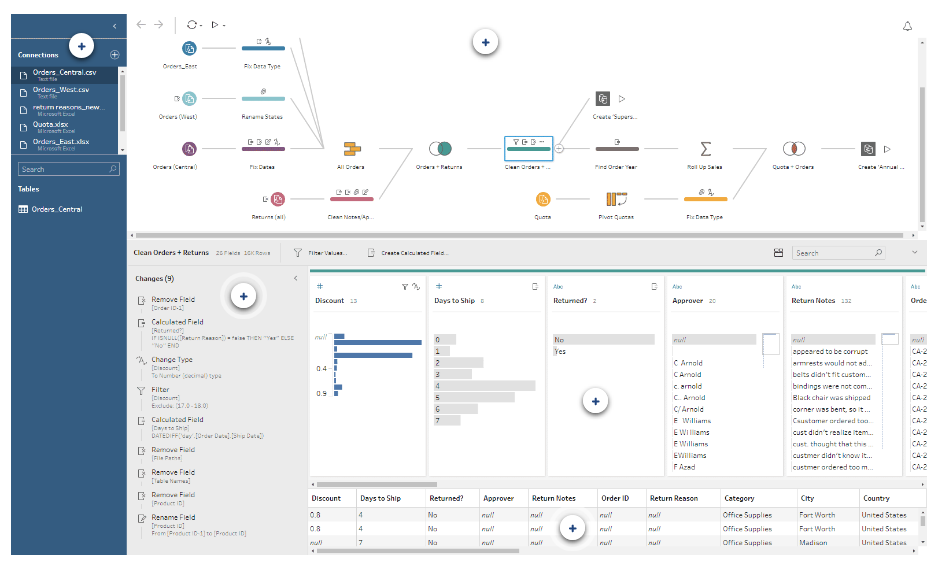
The input step is always the first step in your flow and allows you to configure your data.
- Different types of data are shown with different icons.
- Each separate input has a unique color.
- Hovering over the name of the input step displays the complete table name, if only a portion is showing.
Use a cleaning step to perform many basic cleaning operations, including filtering, renaming fields, and creating a calculation.
- Different categories of operations performed in the step are shown with annotations above the step.
- Hovering over the annotations displays a summary of the operations.
Add a union step to combine data by appending rows of one table to another table.
- The tables in the union should have the same structure; however, mismatched fields can be realigned.
Add a join step to combine data related by common fields.
- The icon for the join step reflects the join type, for example, an inner join.
- A common field can be created using a calculated field.
Add a pivot step to shape data by restructuring your data from columns to rows.
- The icon for the pivot step is a visual reminder of the data reshaping.
Add an aggregate step to adjust the granularity of your data.
- The icon is the Greek sigma symbol for summing numbers, but other types of aggregations are available.
Add an output step to save your cleaned data to a file or publish as a data source.
- Outputs can be a Tableau extract (.hyper and .tde files) or a.csv text file.
Add a cleaning step to the flow
Explore the variety of cleaning operations in Tableau Prep Builder in this eight-minute video, including a brief demonstration of:
- Removing and renaming fields
- Splitting and editing values
- Quick, one-click cleaning operations
- Changing data types
- Filtering
- Creating calculated fields
Note that many cleaning operations can also be performed in other types of steps.
Clean by grouping and replacing values
Dive deeper into the group-and-replace functionality within Tableau Prep Builder, which allows you to group multiple values and replace them with a single value--essentially re-aliasing values. This six-minute video demonstrates how to group and replace values by manual selection and fuzzy matching algorithms for pronunciation and common characters.
Connect, explore, and clean data
Combine and shape data
Output clean data for analysis
Use data roles to validate data
Use data roles to quickly identify whether the values in a field are valid or not. Tableau Prep Builder delivers a standard set of data roles, including email addresses, URLs, and geographic roles, that you can select from, or you can create your own using the unique field values in your data set.
When you assign a data role, Tableau Prep Builder compares the standard values defined for the data role with the values in your field. Any values that don't match are marked with a red exclamation mark. You can filter your field to view only the valid or invalid values and take the appropriate actions to fix them. Once you've assigned a data role to your fields, you can use the Group and Replace option to group and match invalid values to valid ones based on spelling and pronunciation.
Create your own custom data roles using the field values in your data sets to create a standard set of values that you or others can use to validate your field values when cleaning data. Select the field that you want to use, apply any cleaning operations to it if needed, then, publish it to Tableau Server or Tableau Online to use it in your flow or share your data roles with others.
Perform more complex cleaning using R and Python scripts
Use R and Python scripts to perform more complex cleaning operations or incorporate predictive modeling data into your flow. Data is passed from the flow as input through the R or Python script step using Rserve or TabPy, then returned as output data that you can continue cleaning using the features and functions in Tableau Prep Builder.
When you add a script step to your flow and enter in the configuration details for the selected service, Tableau Prep Builder passes the data to Rserve for R or Tableau Python server (TabPy) for Python and returns the resulting data back to the flow in the form of a table. You can continue to apply cleaning operations to the results and generate your output for analysis.
When you create your script, you will need to include a function that specifies a data frame as an argument of the function. If you want to return different fields than what you input, you'll need to include a getOutputSchema function in your script that defines the output and data types. Otherwise, the output will use the fields from the input data.
Best practices for using Tableau Prep Builder
Tips for effective data cleaning and preparation
Data preparation is the process of cleaning dirty data, restructuring ill-formed data, and combining multiple sets of data for analysis. It involves transforming the data structure, like rows and columns, and cleaning up things like data types and values. The speed and efficiency of your data prep process directly impacts the time it takes to discover insights. Understanding the scope of data you’re analyzing and seeing the changes you make to the data can accelerate the entire process.
The whitepaper describes five best practices for using Tableau Prep Builder effectively:
- Think about data holistically.
- Know the structure of your data.
- Keep track of your steps.
- Spot-check throughout.
- Run the flow and start your analysis.
Publish and schedule data flows
Automate data prep flows to run on Tableau Server or Tableau Online
Get started with Tableau Prep Conductor
With Tableau Prep Conductor, part of the Data Management Add-on, you can publish and run flows in your server environment so your data is always up to date. To learn how to use Tableau Prep Conductor to schedule, monitor, administer, and govern your flows, watch the six-minute video, below.
Keep data fresh automatically
- Schedule your flows to run when you need them.
- Automate the tasks of running flows and create a repeatable process, so there’s consistency in the delivery of prepared data.
Stay informed with alerts and run history
- See a historical view of your flows’ run history, including successful or failed runs at a glance.
- Keep track of the quality of your prep flows with out-of-the-box alerts if a flow fails.
Create a governed prep environment
- Build rules and permissions around data sharing and refreshes.
- Leverage existing permissions and infrastructure in Tableau Server or Tableau Online to control who can publish, view, and run flows.
Increase data discoverability
- Use simple management capabilities, including keyword tagging, moving flows between projects, and setting user permissions, to help users across the organization find relevant, prepared data.