Advantages of Visualisations
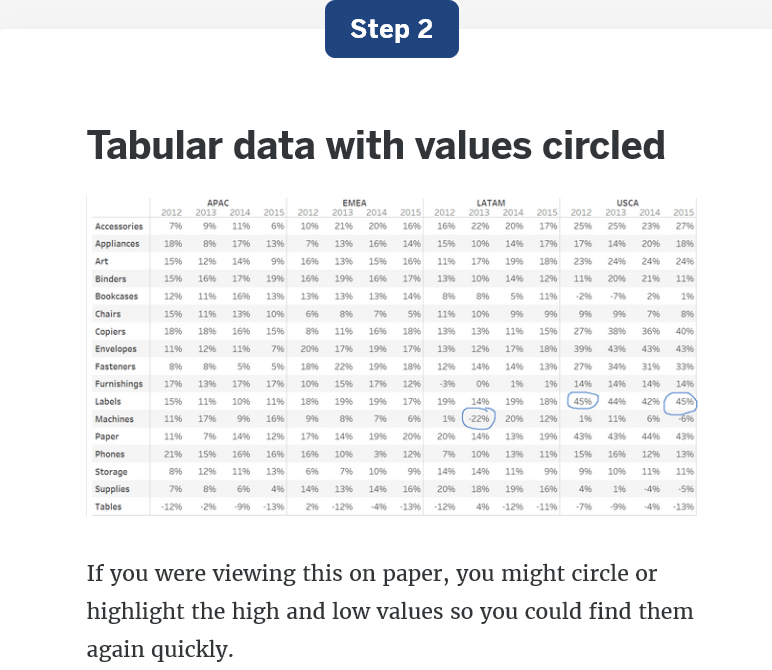
Visualizations help us understand complex data
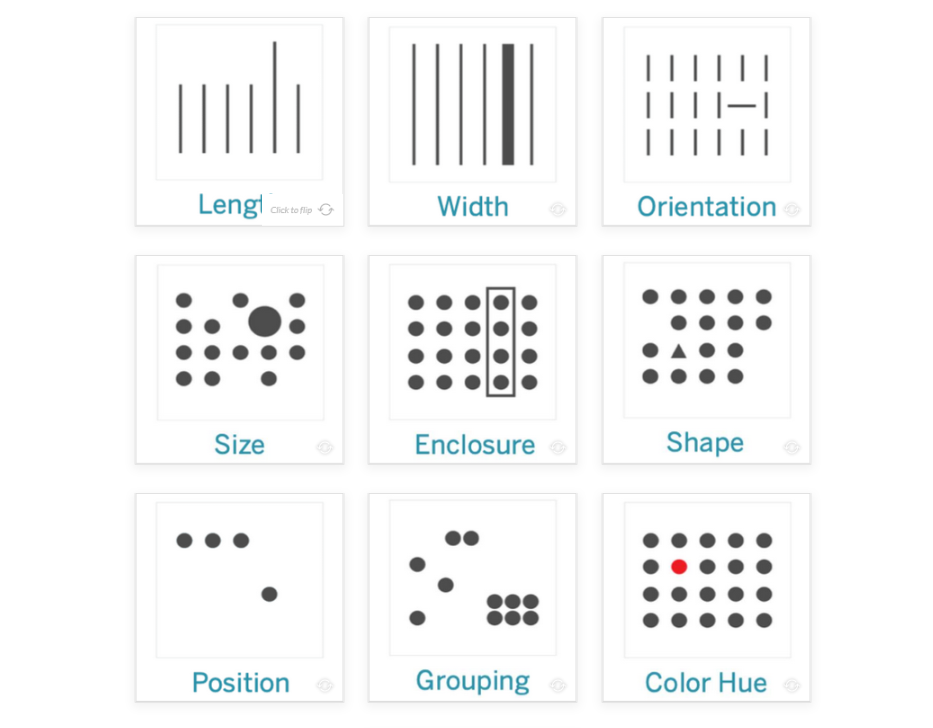
The best reason to use a visualization to understand your data is that most data sets are far too large to consume in their raw format. Humans are limited in what information we can process and compare in our heads, especially if that information resides in a million-row data set, but we are good at quickly processing visual information. Even if you are new to reading data in a chart, you already have the built-in capabilities to spotlight and dark colors, large and small shapes, groups, and orientations of objects. These are referred to as pre-attentive attributes.
Visual analytics leverages our pre‑attentive attributes – visual cues humans process automatically with sensory memory. We can notice and interpret these kinds of attributes quickly and without special effort. Some pre-attentive attributes are better at showing quantitative (measured) data, and some are better at showing qualitative (categorical) data. For example, using length of bars to represent the amount of sales is an effective choice to indicate differences in sales across categories.


