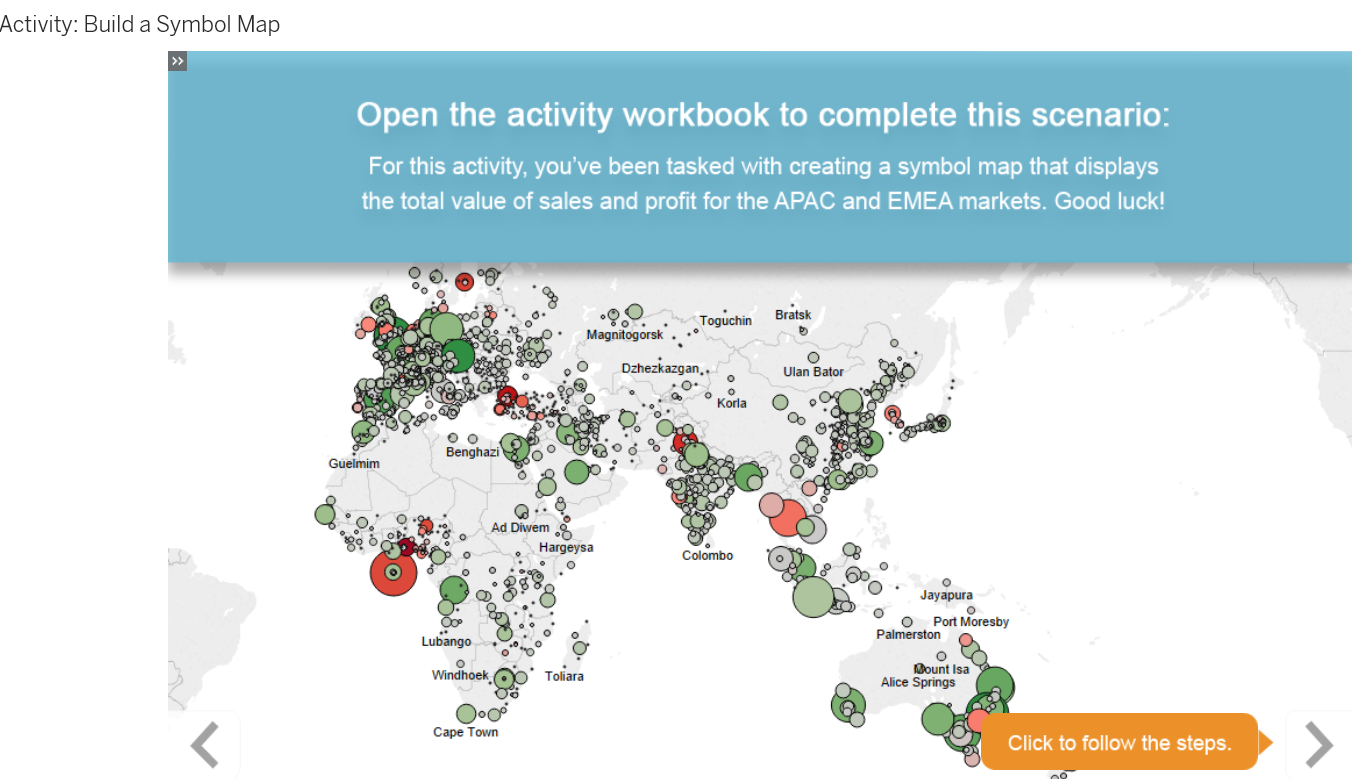
Mapping Data Geographically
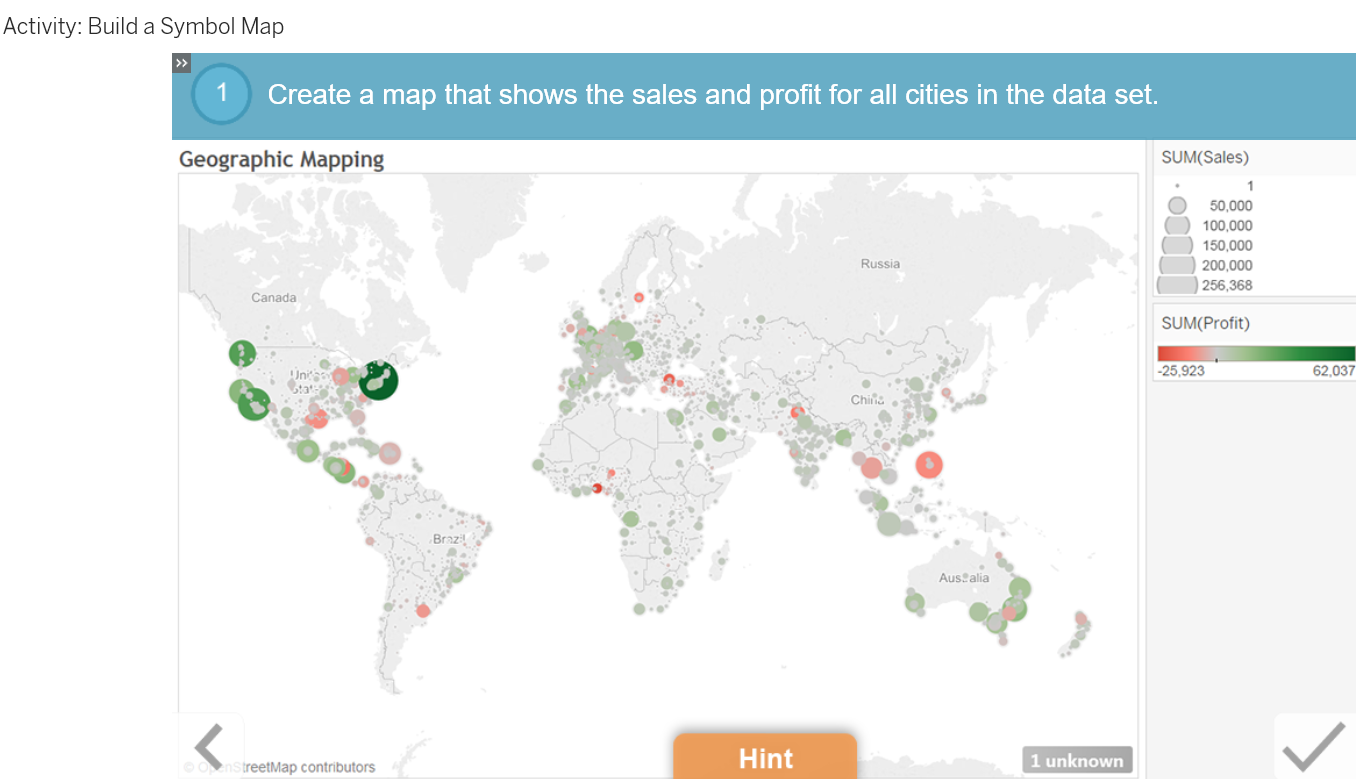
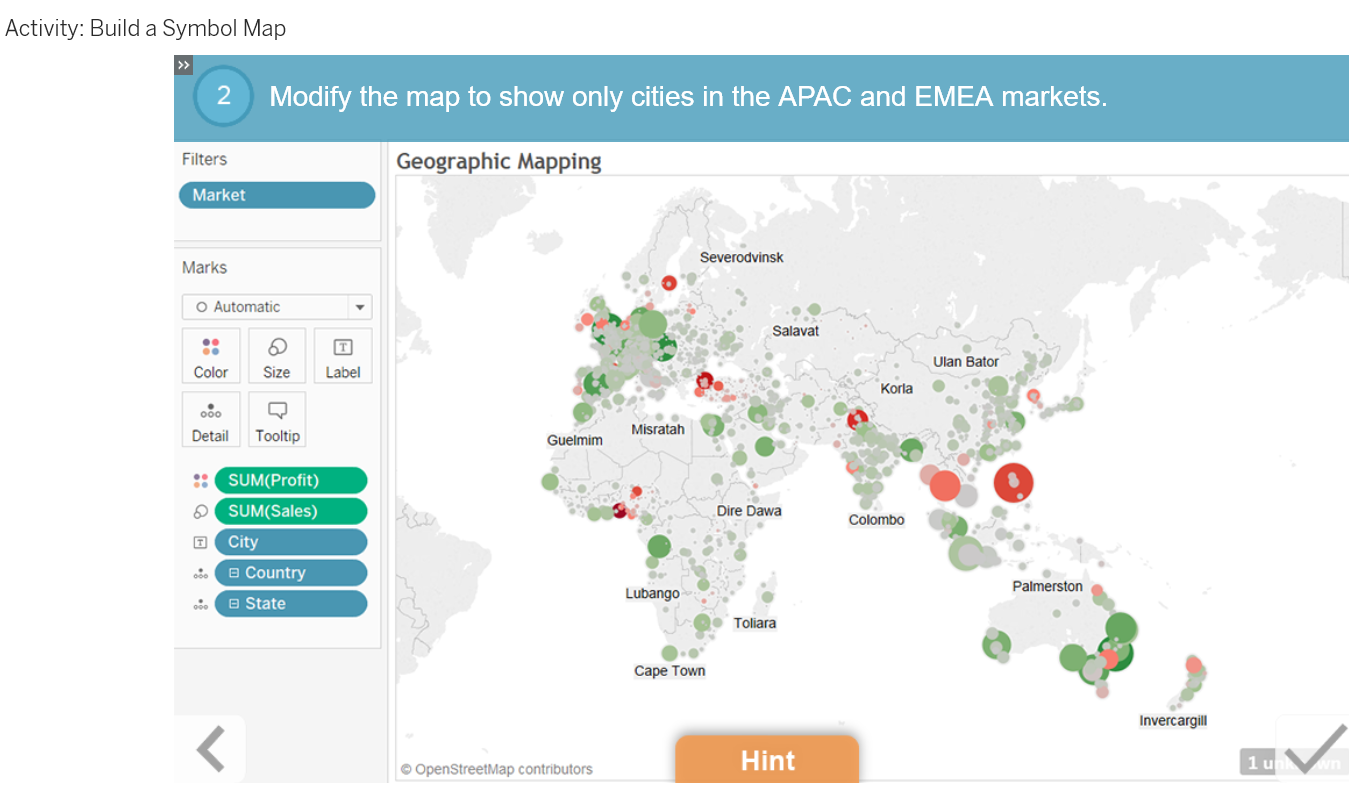
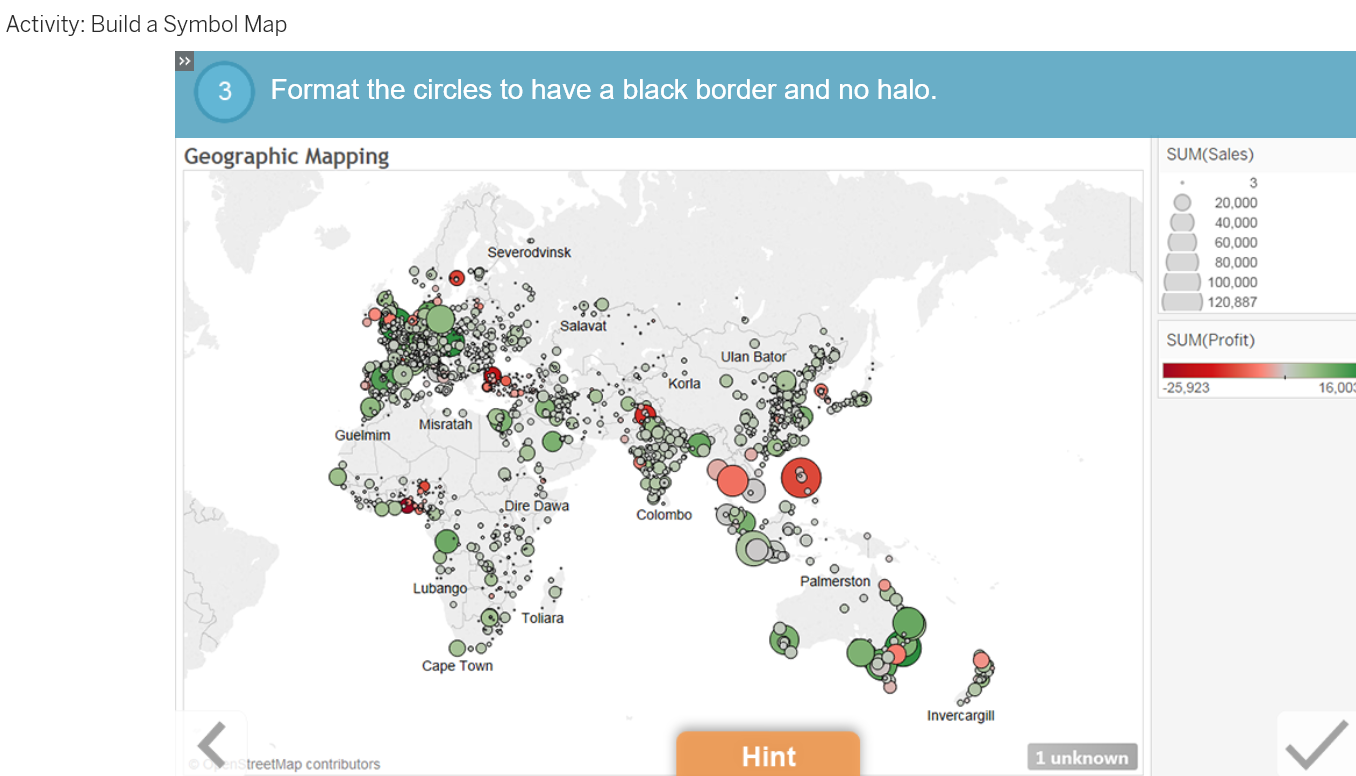
If you have geographic data, map it! Use Tableau's automatic geographic role detection to plot data across cities, states, and nations. Create a symbol map to plot data across regions.
Lesson Objectives
At the end of this lesson, you will be able to:
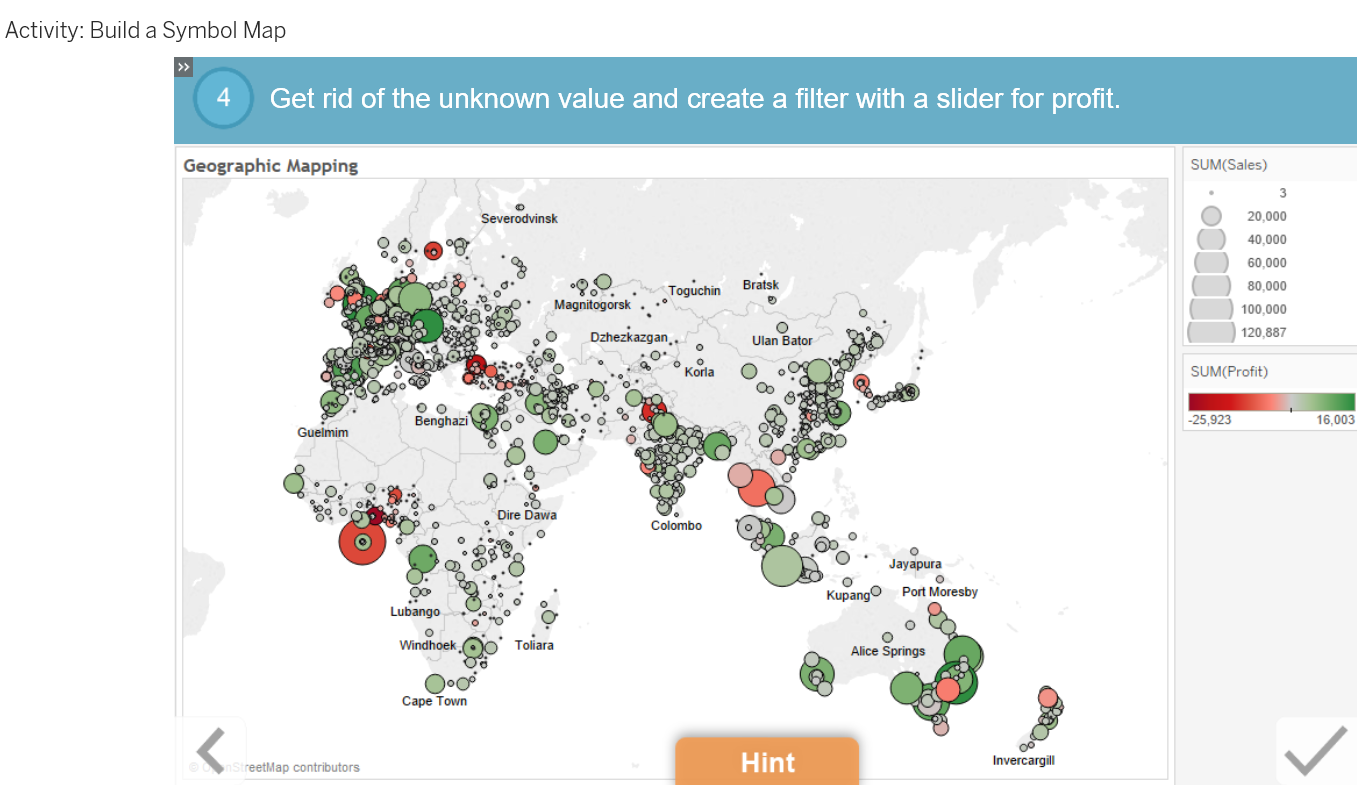
- Create a symbol map.