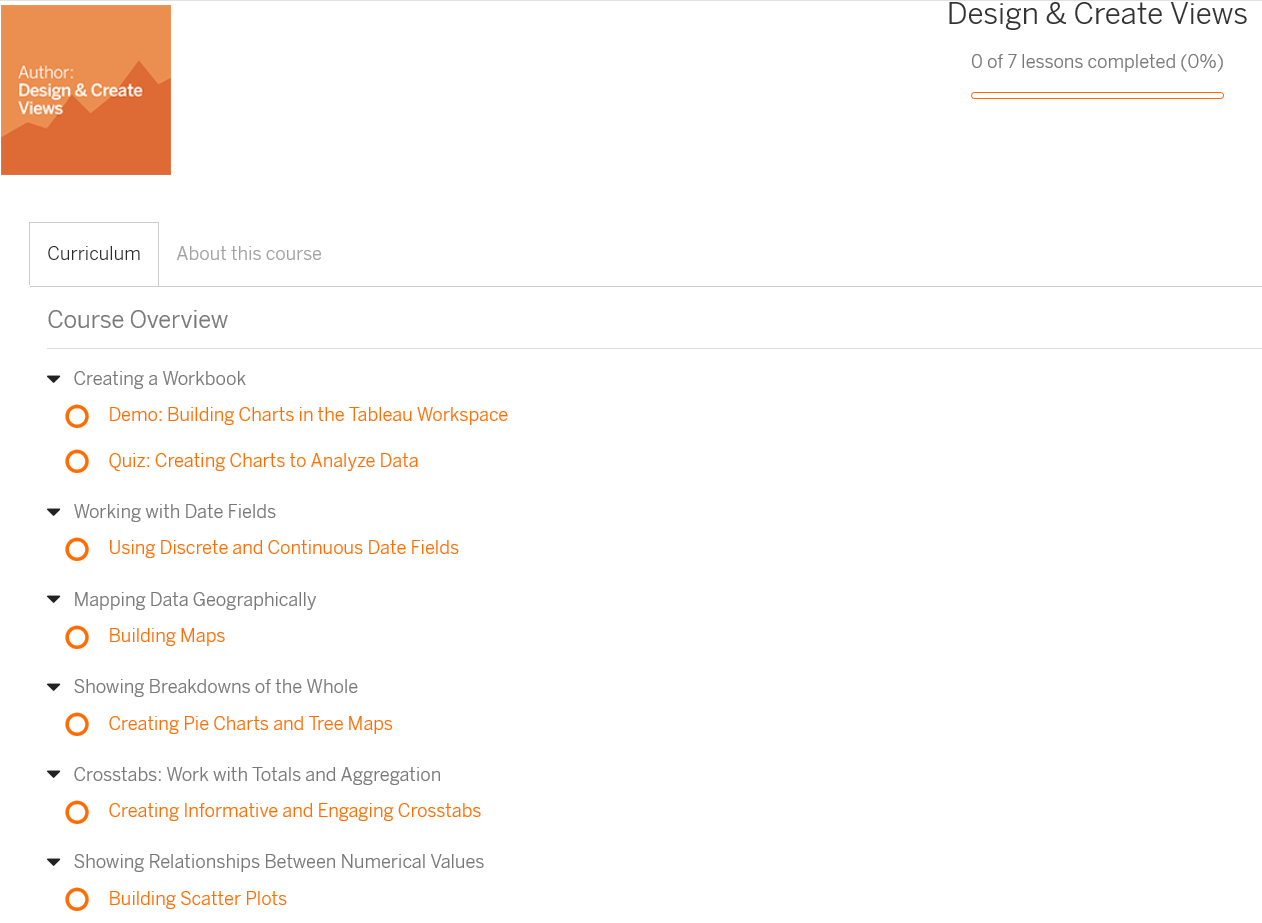
Design and Create Views
Estimated time: 4 hours
About This Course
In this course, you’ll apply your design and visualization capabilities as a web author on Tableau Server or Tableau Online. (This assumes site permissions suited to an Explorer “can publish” role.) You will learn how to connect to a published data source and create new visualizations. You’ll also represent data using various charts, such as bar and line charts, crosstabs, and scatter plots.
Learning Objectives
- Connect to a data source to start a new workbook.
- Use the Tableau workspace to create essential visualization types.
- Work with date fields to show time-based data.
- Represent your data using the following charts:
- Bar chart
- Crosstab (text table)
- Line chart
- Geographic map
- Pie chart
- Tree map
- Scatter plot
