Row level records
"What does a row of data contain?" is a simple but important question, and it can have a complex answer. Remember the commuter data we reviewed in the previous lesson?
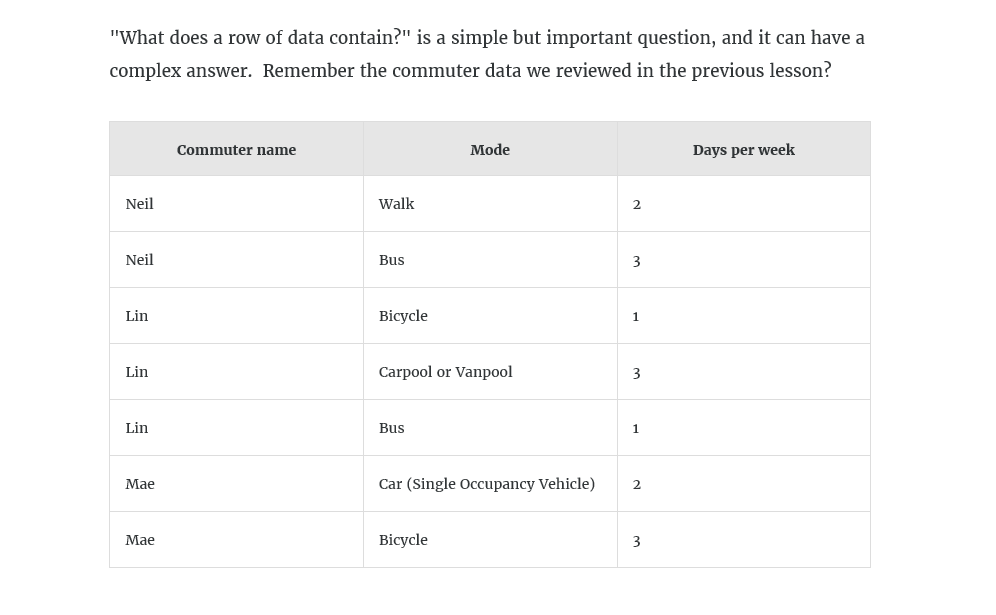
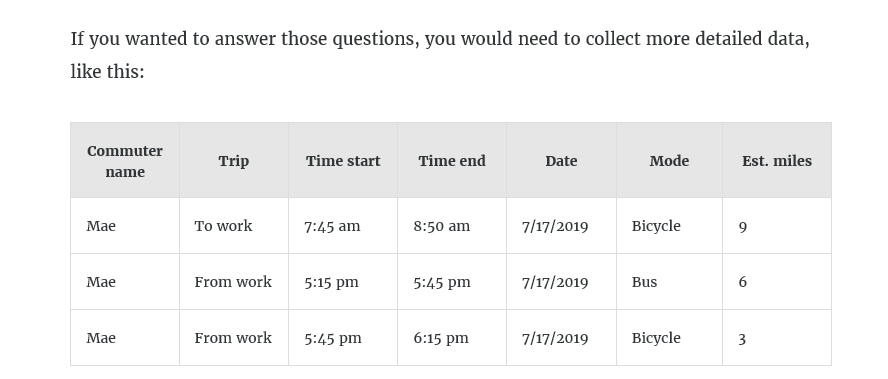
Each row captured the number of days per week a commuter used a particular mode of transportation to get to work, but it did not include a lot of details about the trips. For example, most people take two commuting trips a day if they go to work, and they might choose a different mode of transportation for each. Commuters might use multiple modes on a single trip to get to work or to get home. Our first data set doesn't capture those details.
What if you wanted to know:
- How many commuters used multiple modes of transportation in a single day?
- How did commutes to work compare against commutes from work?
- How long did different commutes take?
- What was the length of each trip?
Why does knowing data granularity matter?
Data granularity refers to the level of detail for a piece of data, wherever you are looking. As data becomes less granular, we might describe it as an aggregation, or as aggregated data. Aggregation refers to how data is combined. The level of granularity or aggregation in a row or chart affects the questions we can ask of the data, and the discoveries we can make.
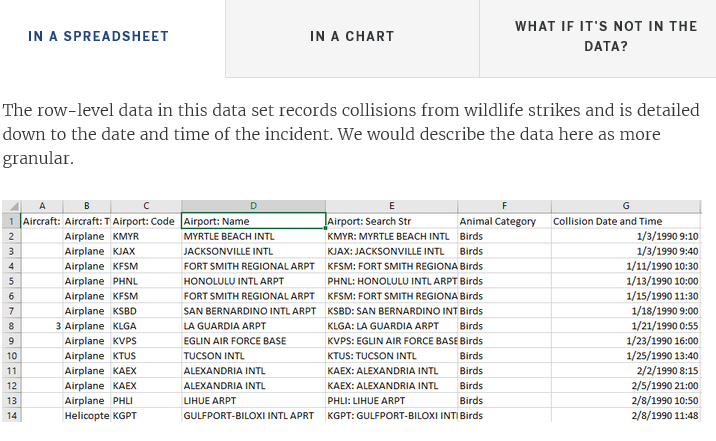
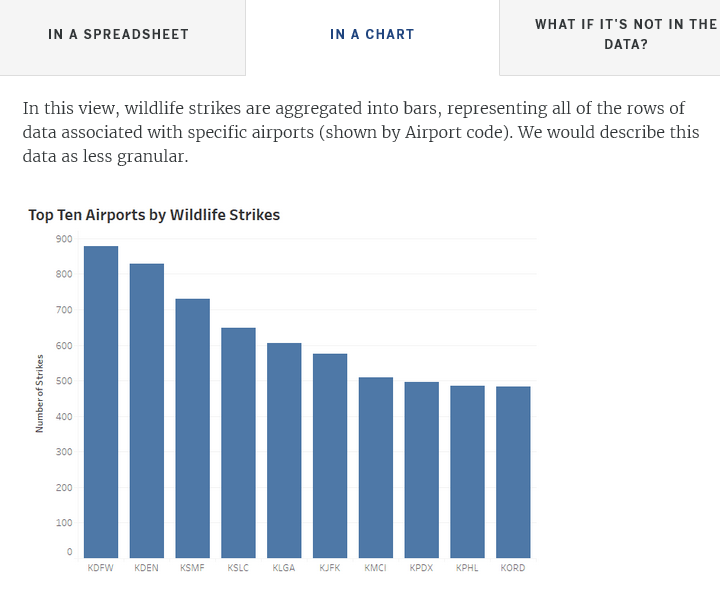
How can I determine the level of detail contained in a row of data when I only have access to a visualization? You can select a mark in a visualization, and then right-click to view underlying data, if the view's author has enabled it. You can view the row-level records of the data behind the visualization, which is how you can determine the depth of detail the data set contains.