Introduction to Tableau Desktop
In this introductory module, you will:
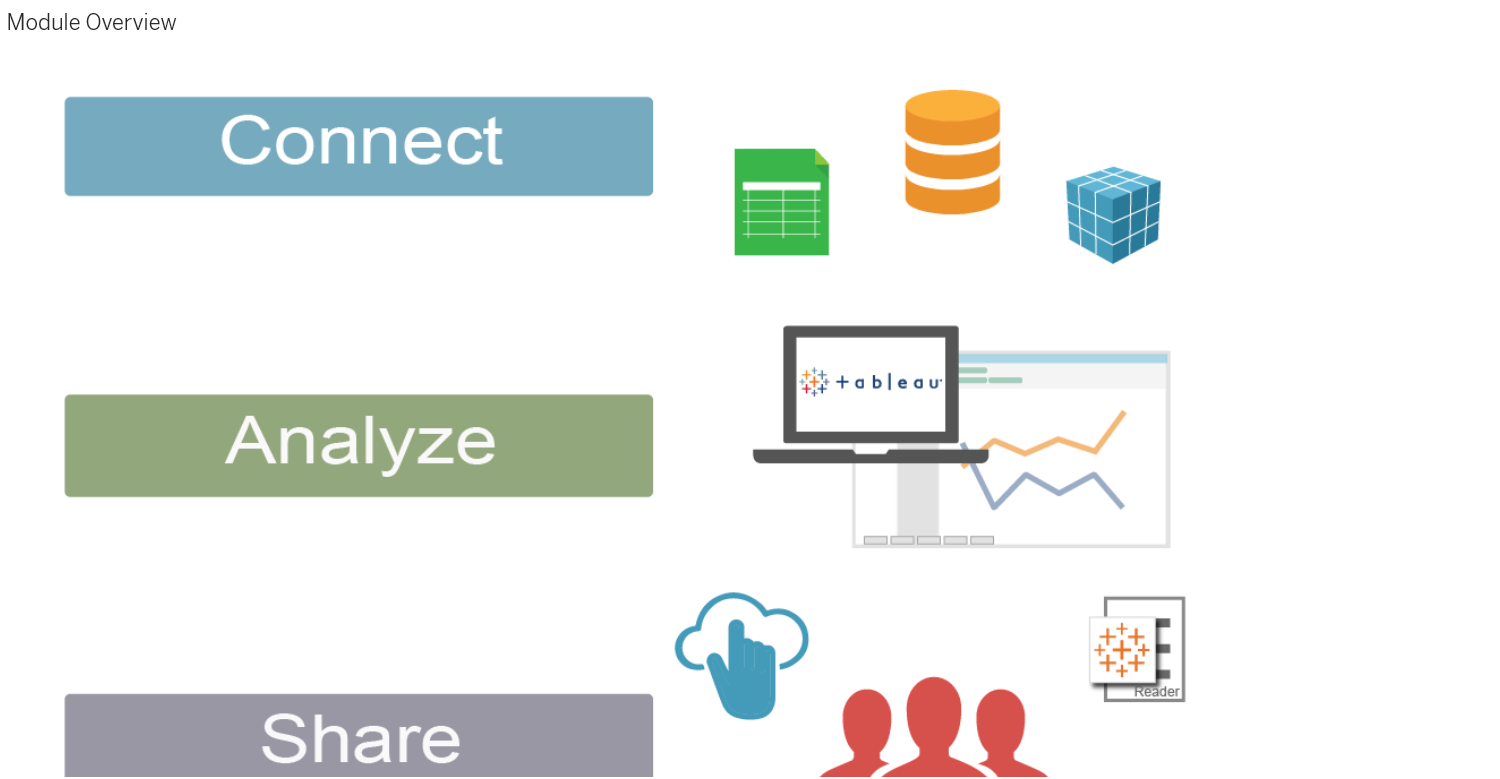
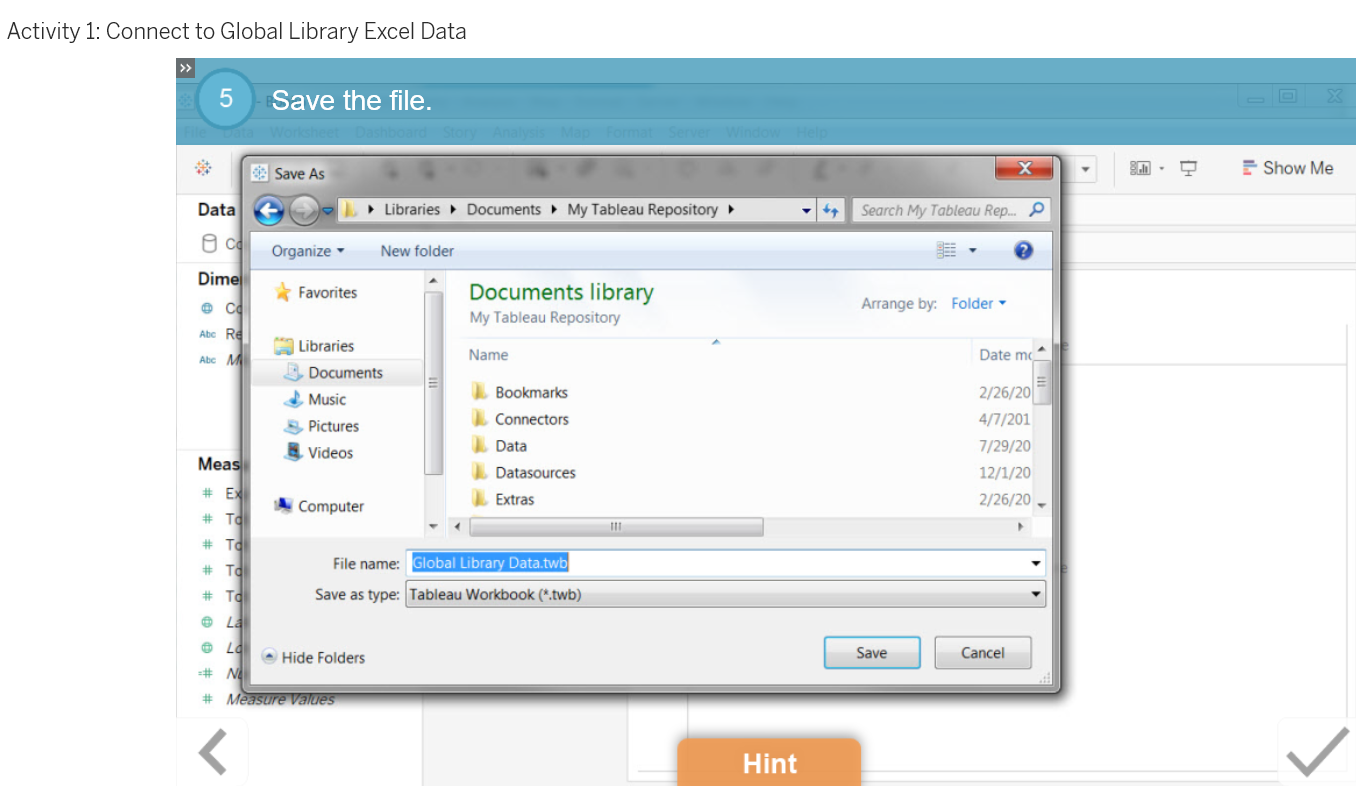
- Get the big picture of the workflow in Tableau Desktop, in which you connect to your data, analyze it, and share your discoveries.
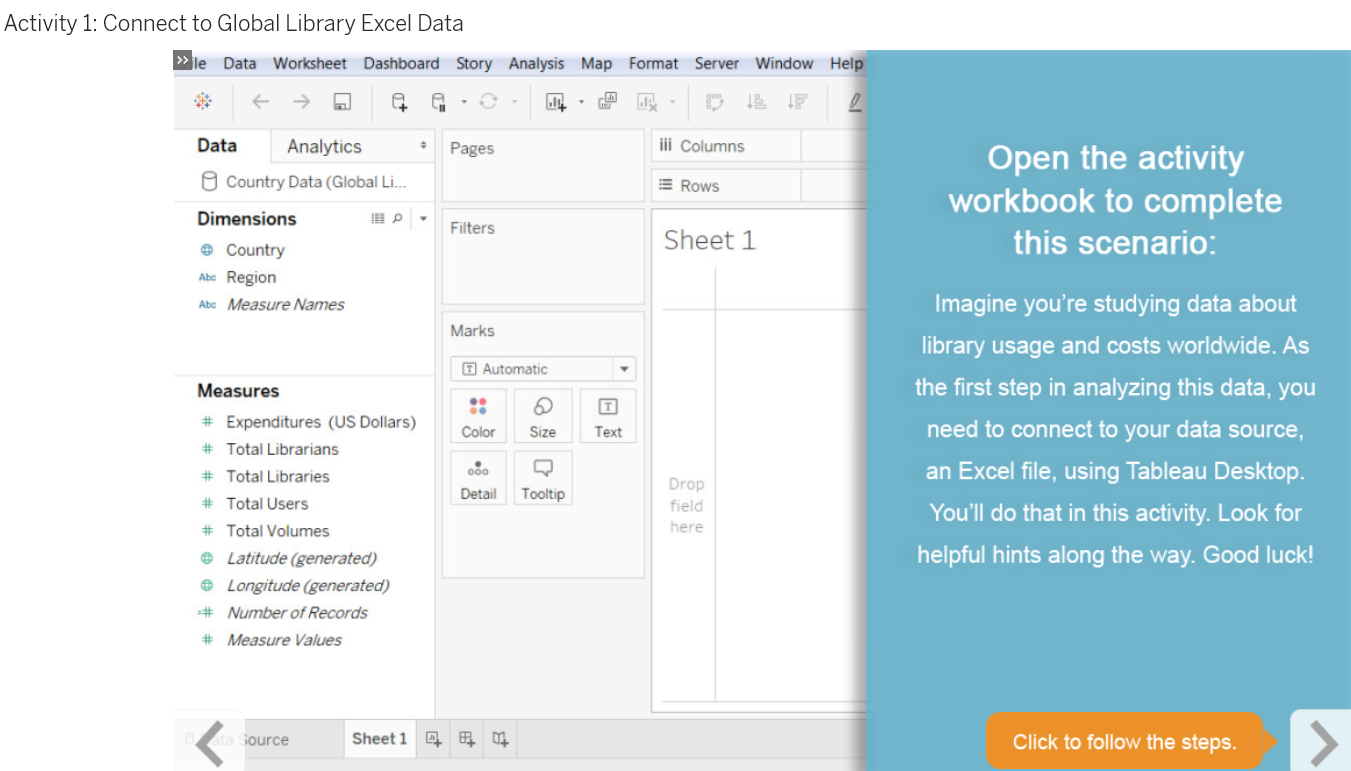
- See this process in detail in the lesson demos about connecting to a data spreadsheet, working with data to build visualizations, and creating an interactive dashboard.
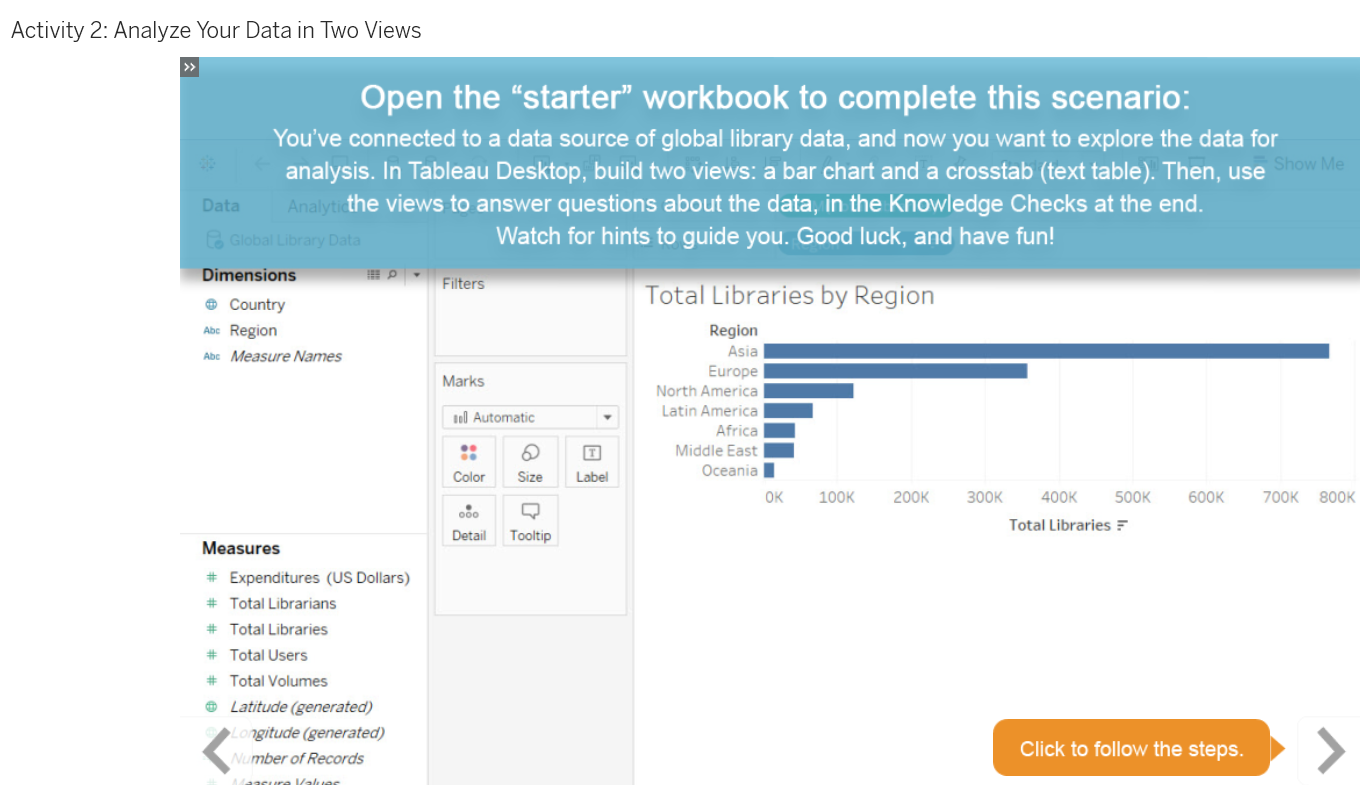
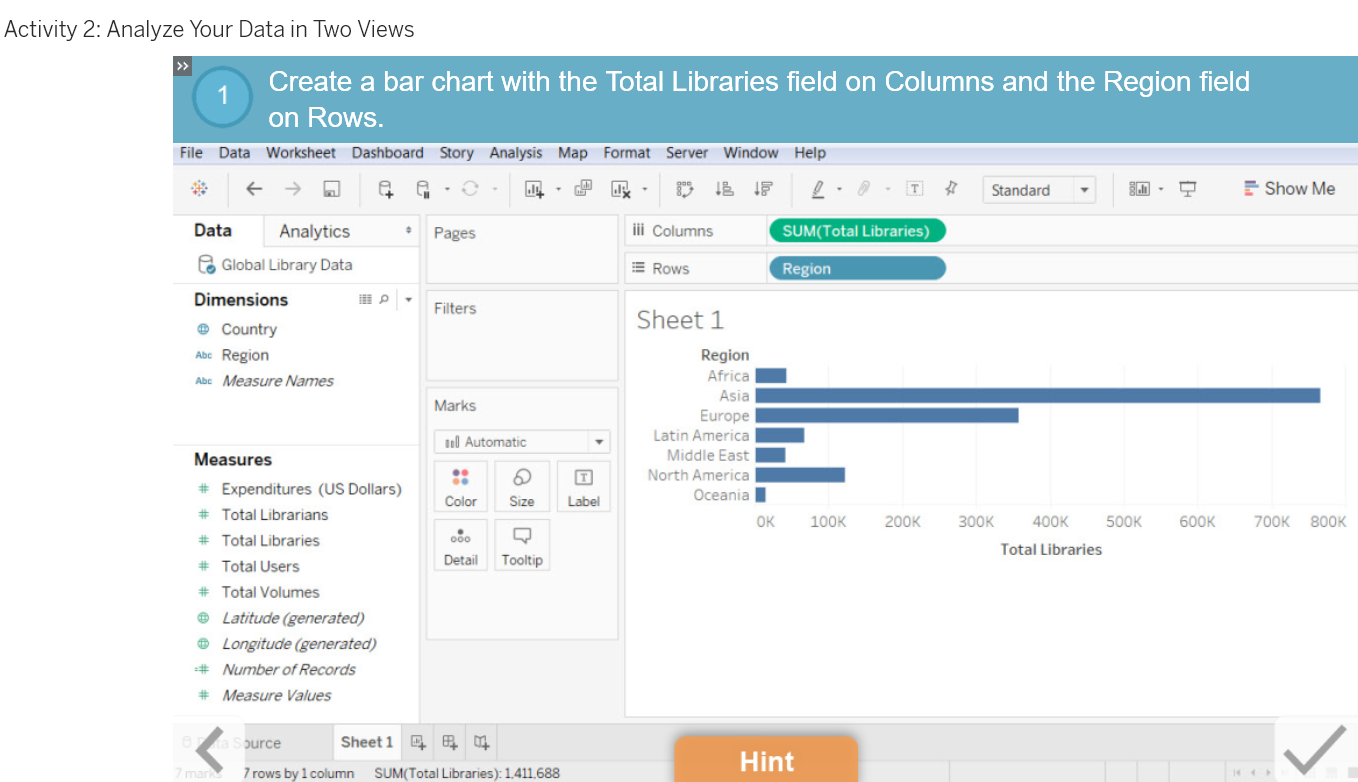
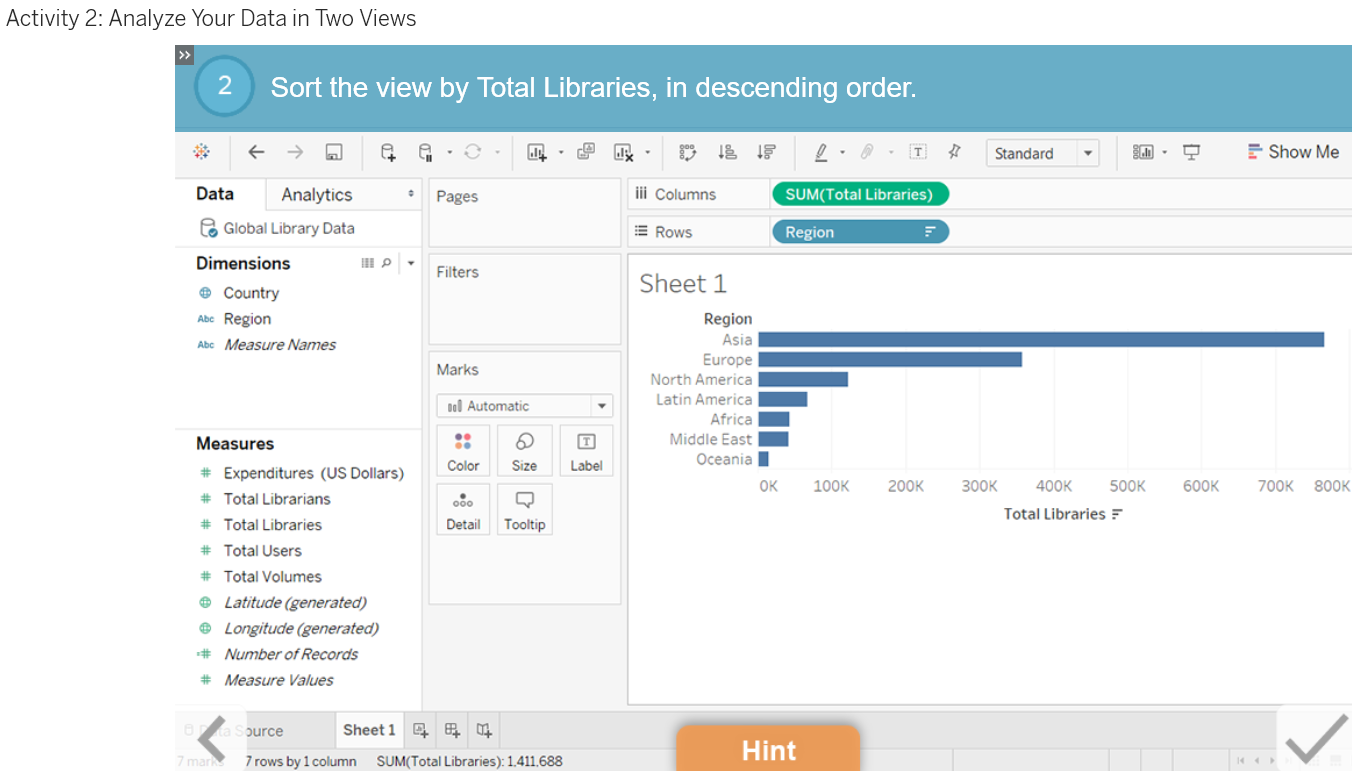
- Try it all yourself in the activities. You’ll work with a global library data set to create visualizations and a dashboard to answer questions about the data.
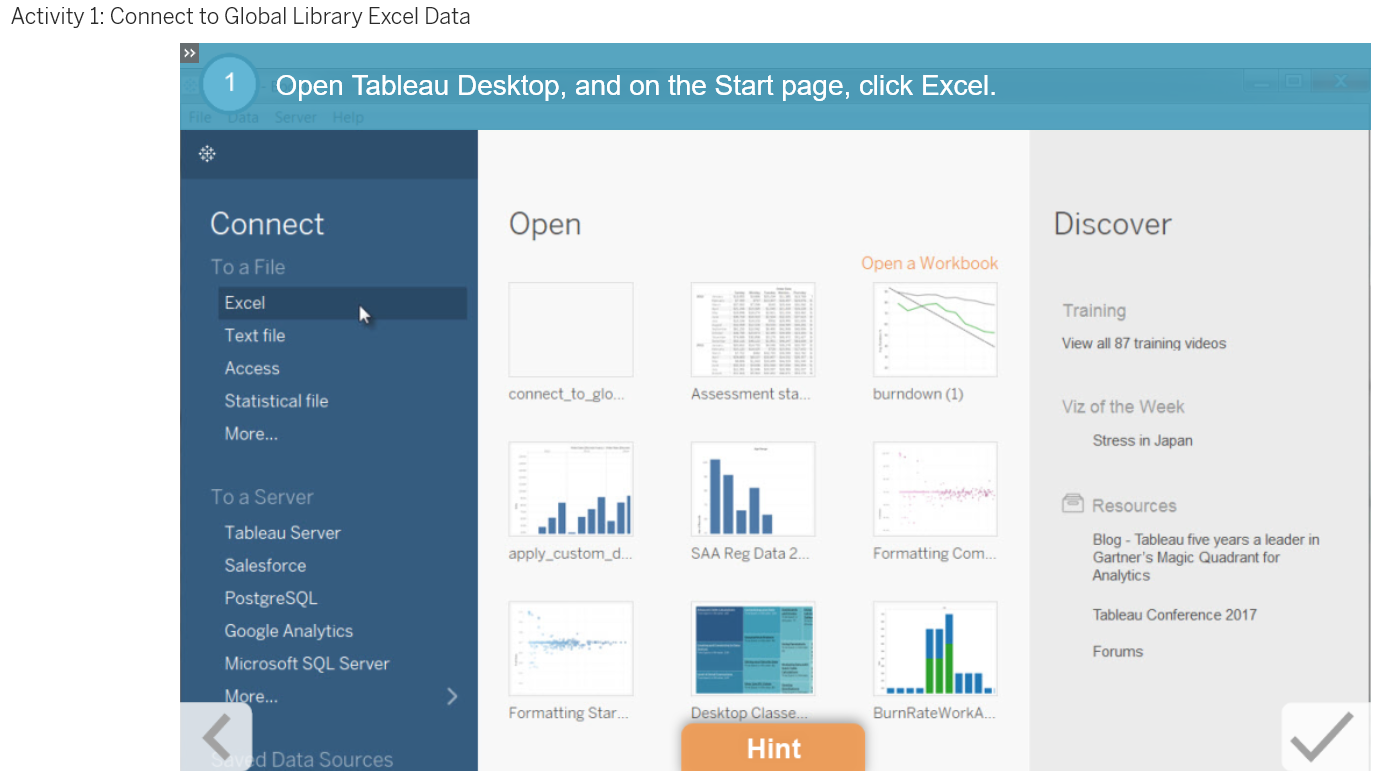
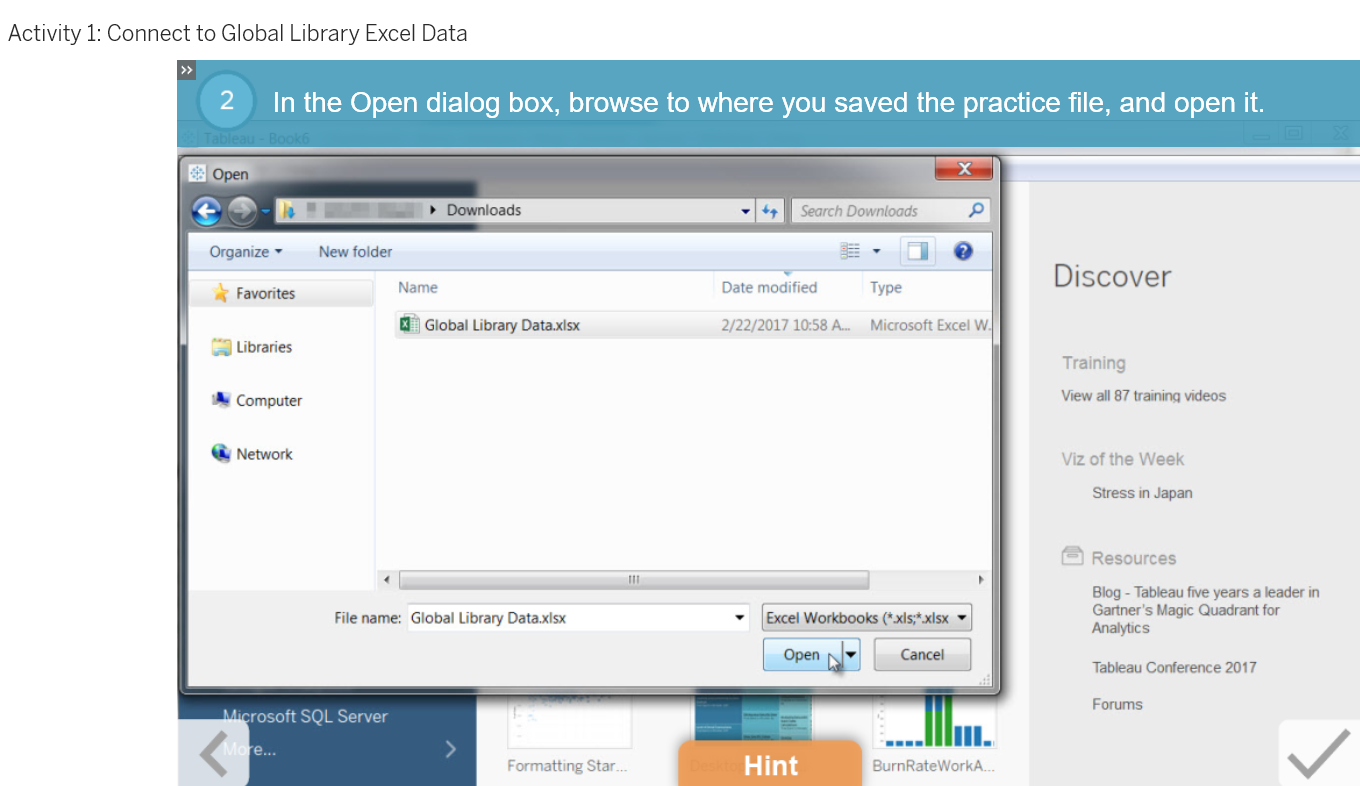
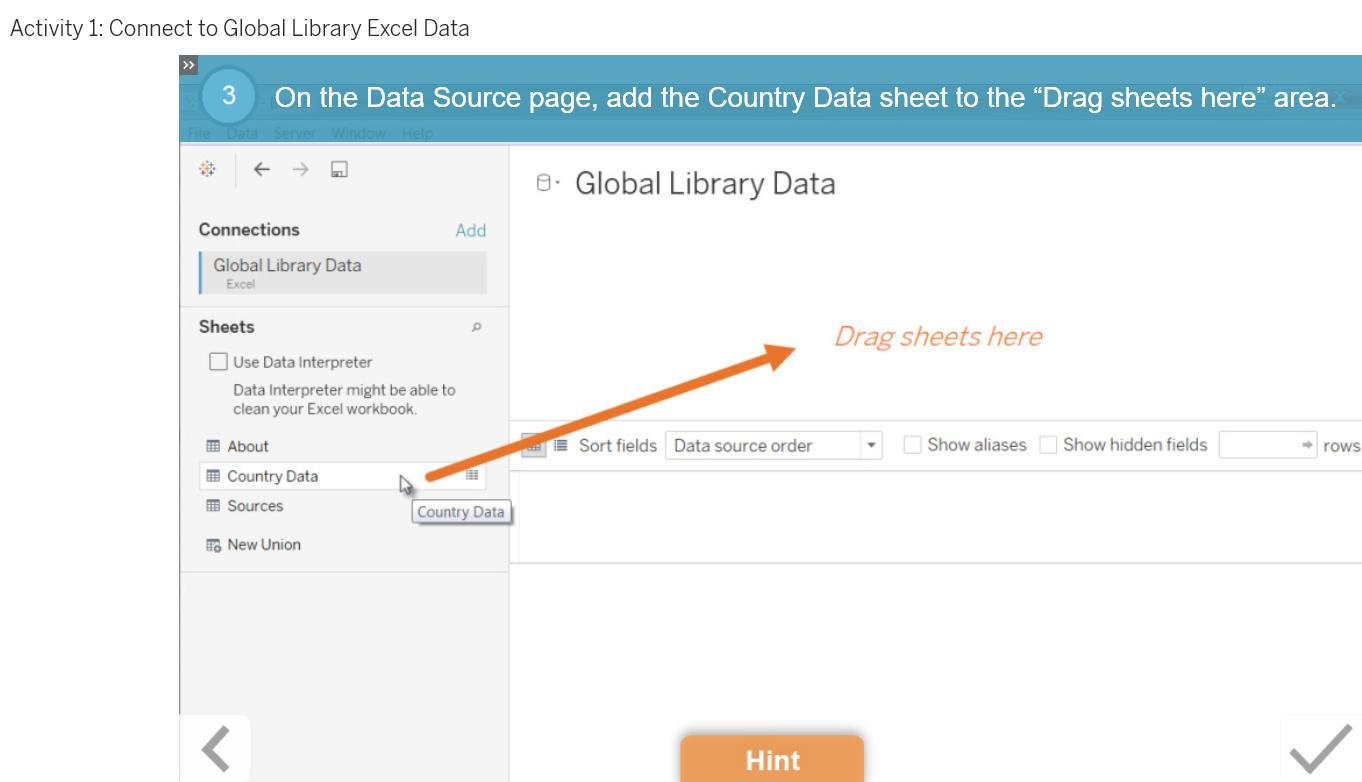
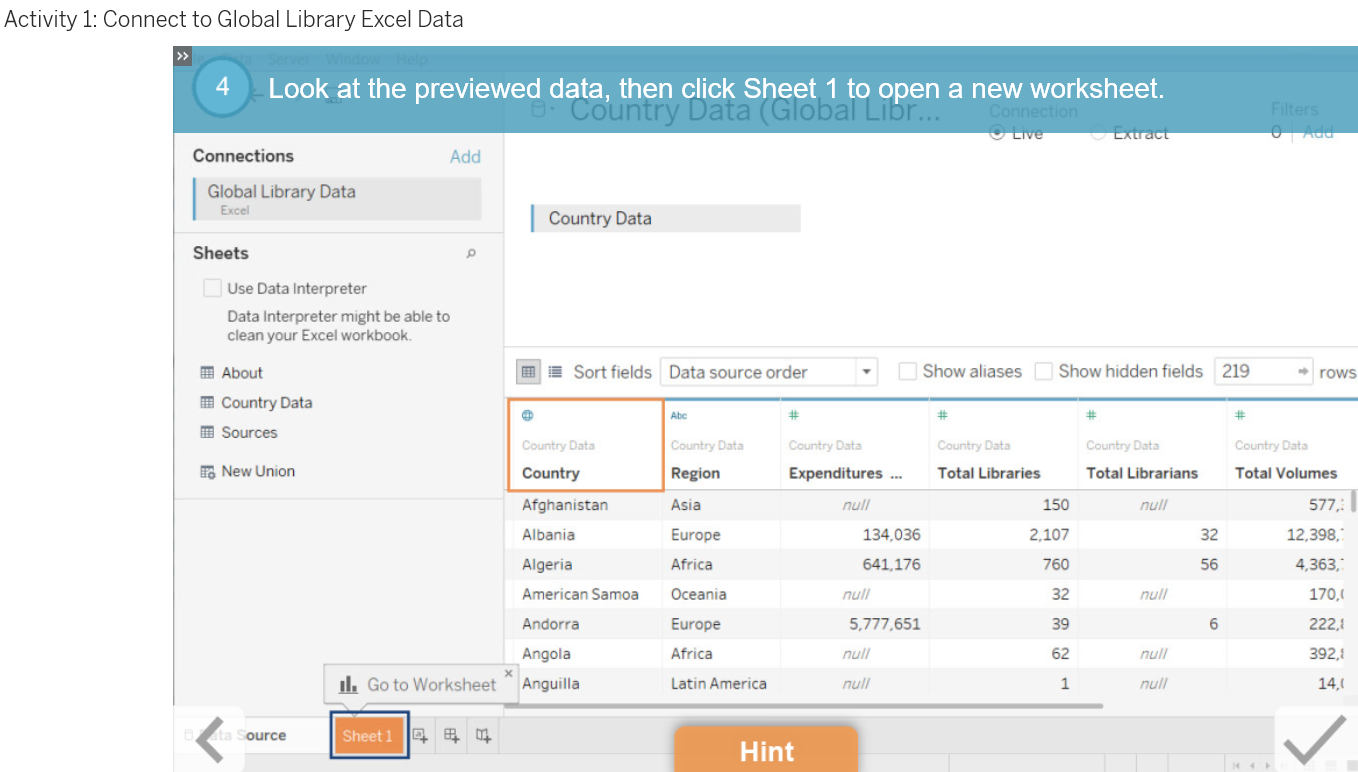
Analyze Your Data in Two Views
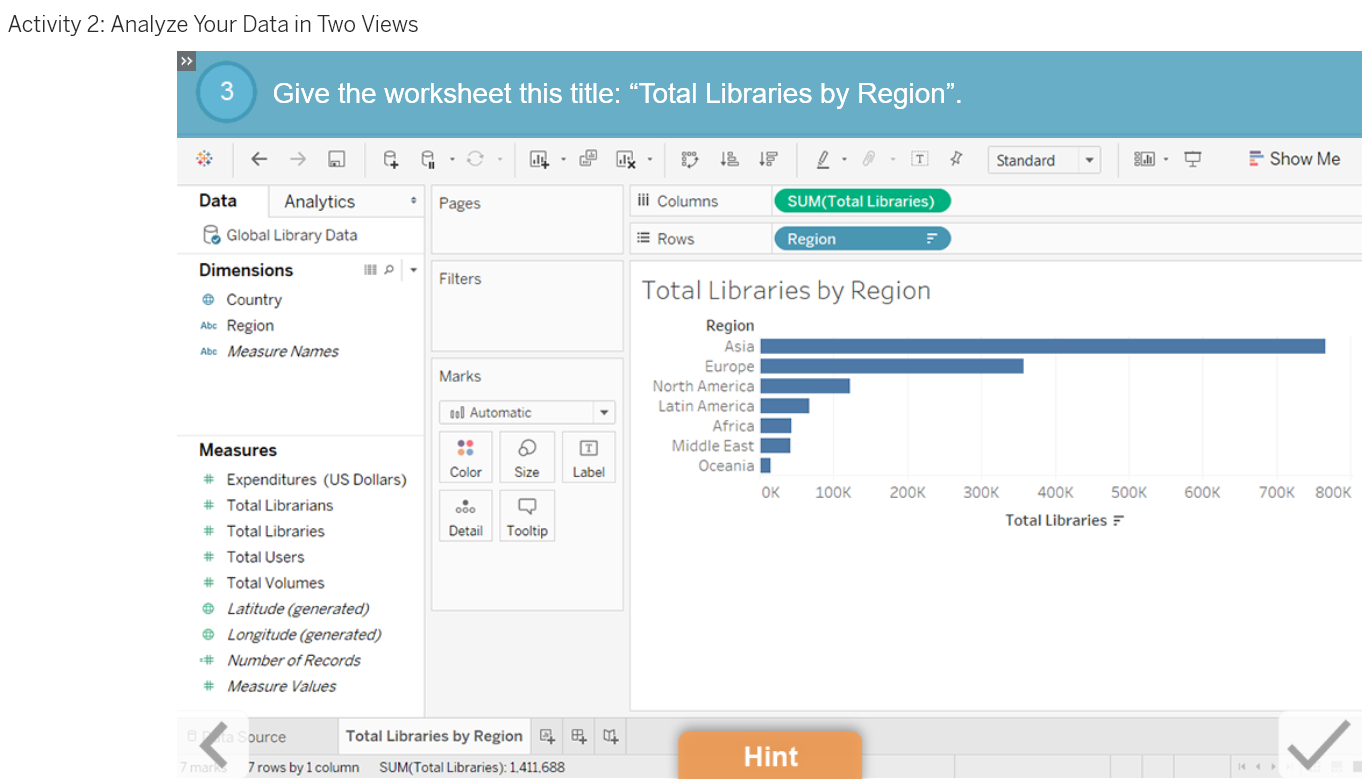
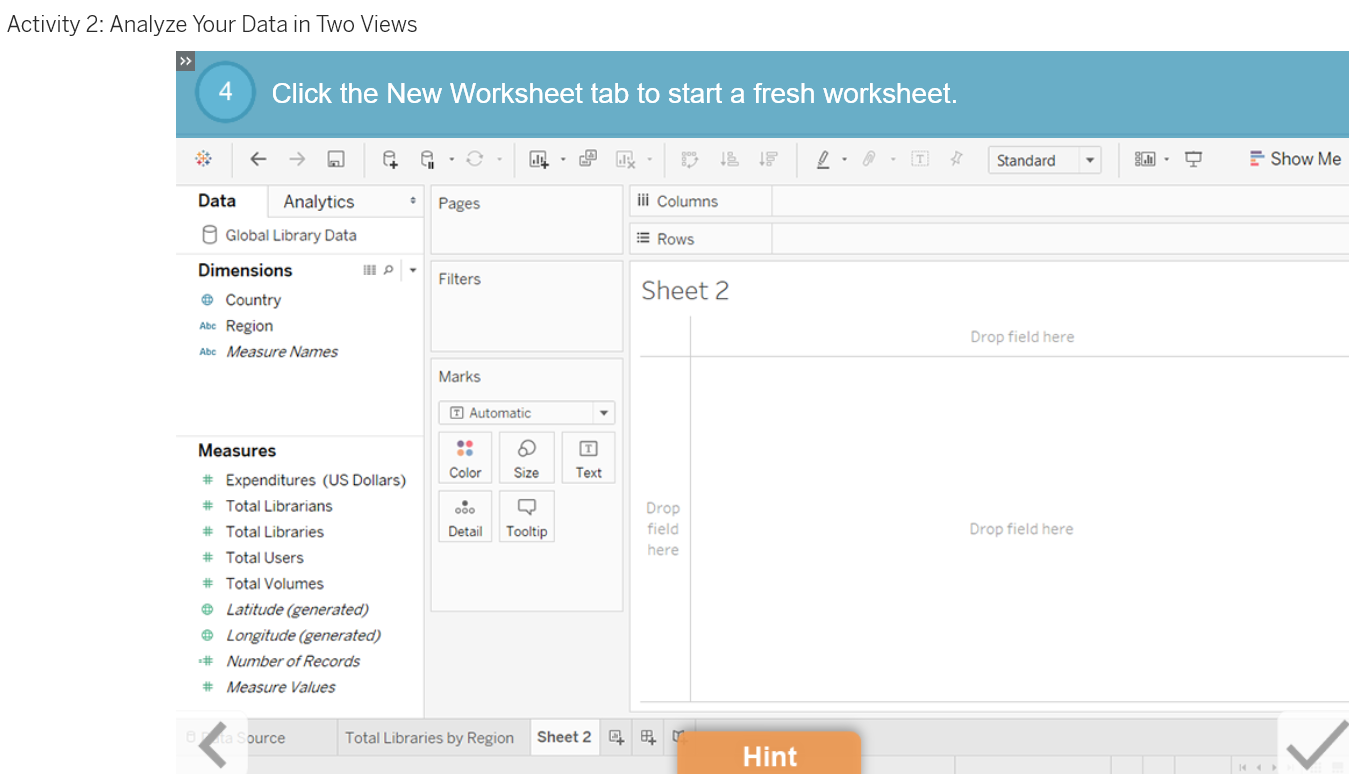
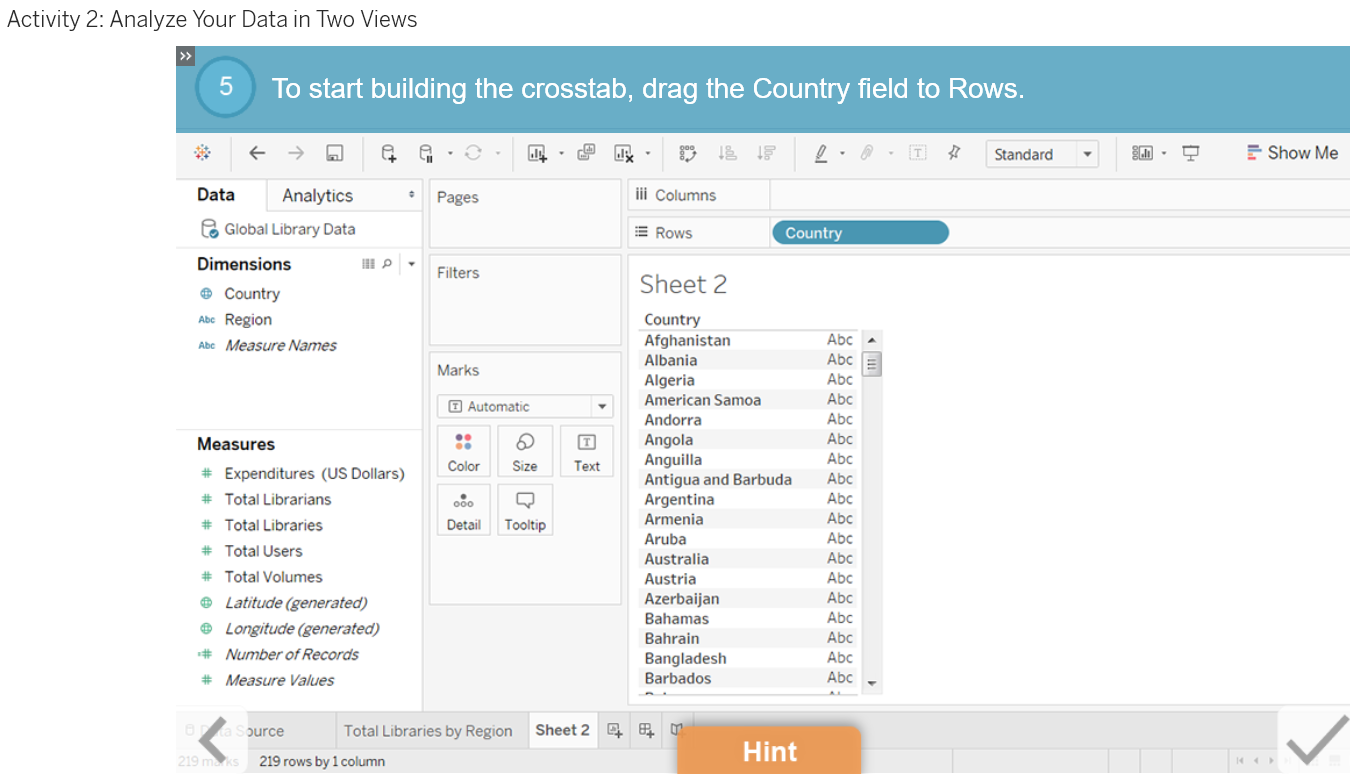
Lesson Objectives At the end of this lesson, you will be able to: Create and use basic visualizations to answer questions about data. This lesson was produced using Tableau Desktop 10.0. Please download the following resource files before you begin.
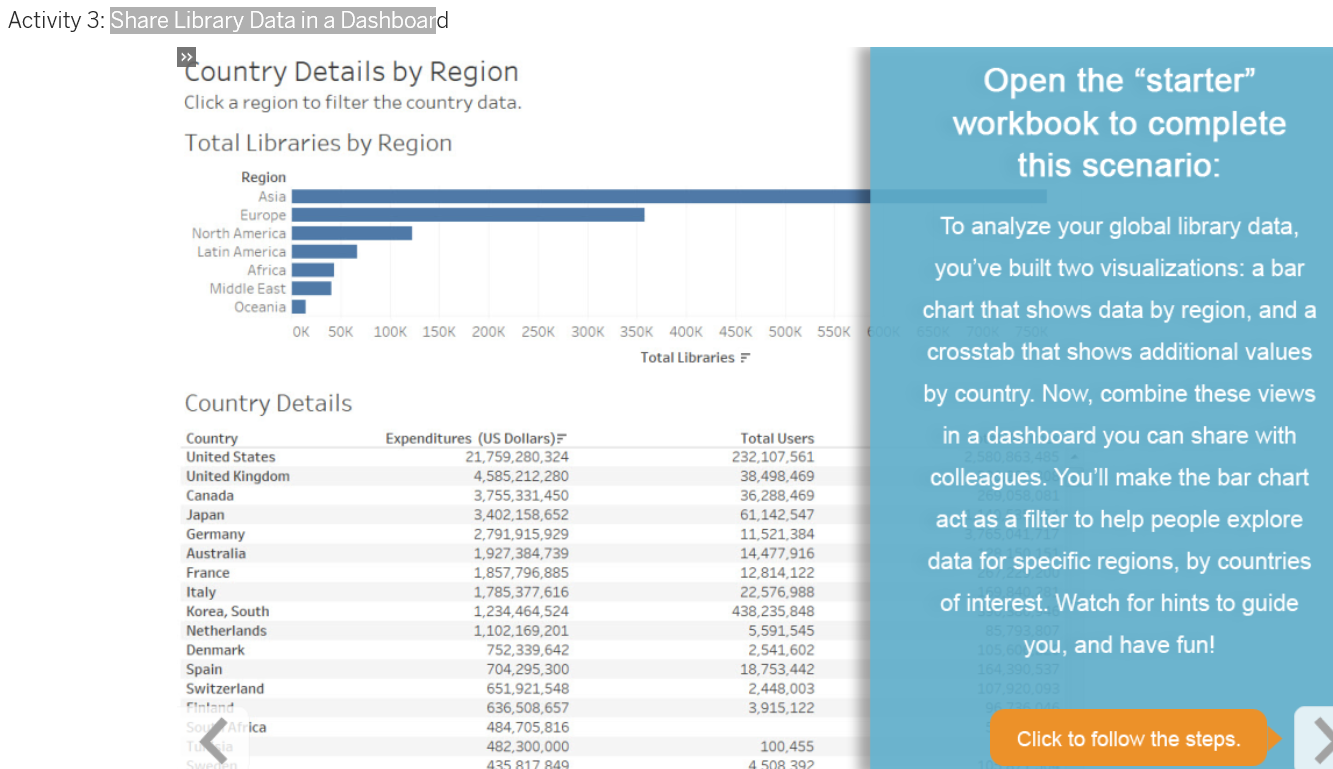
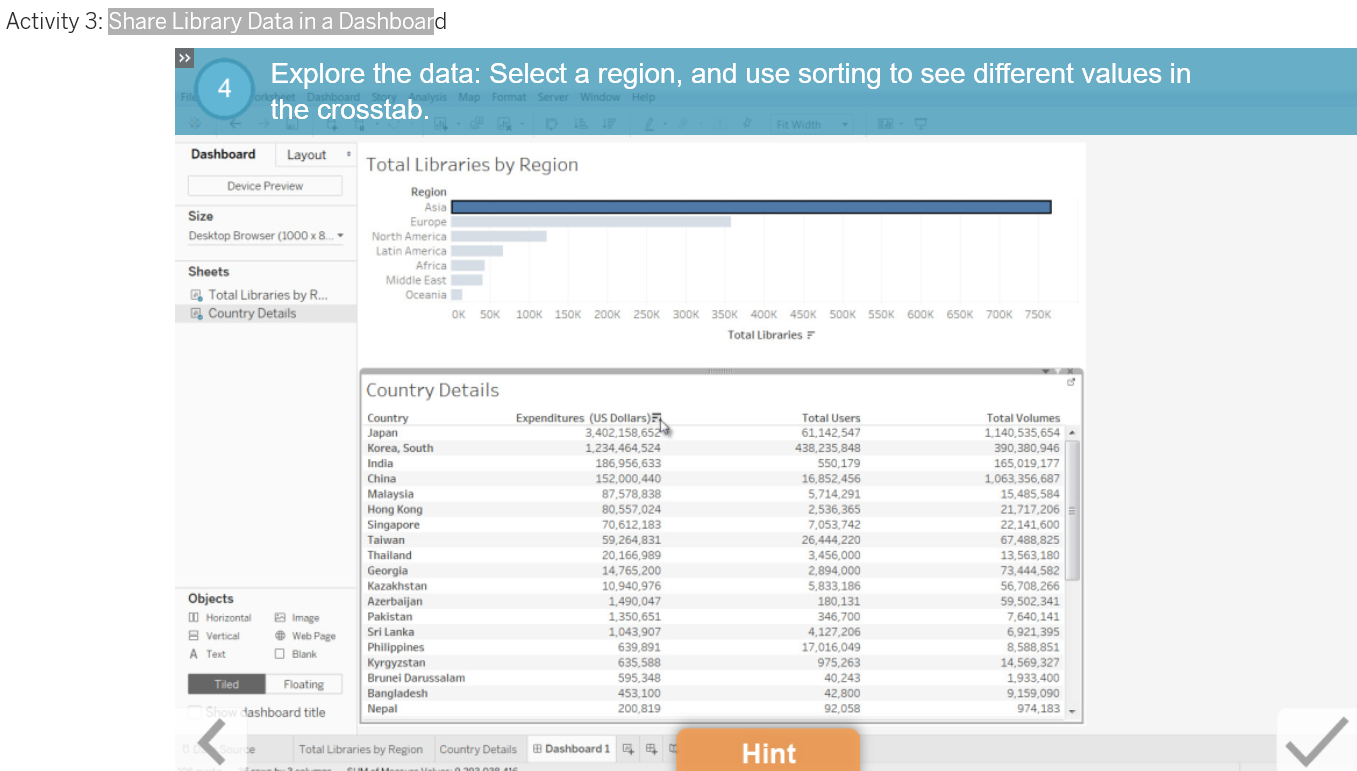
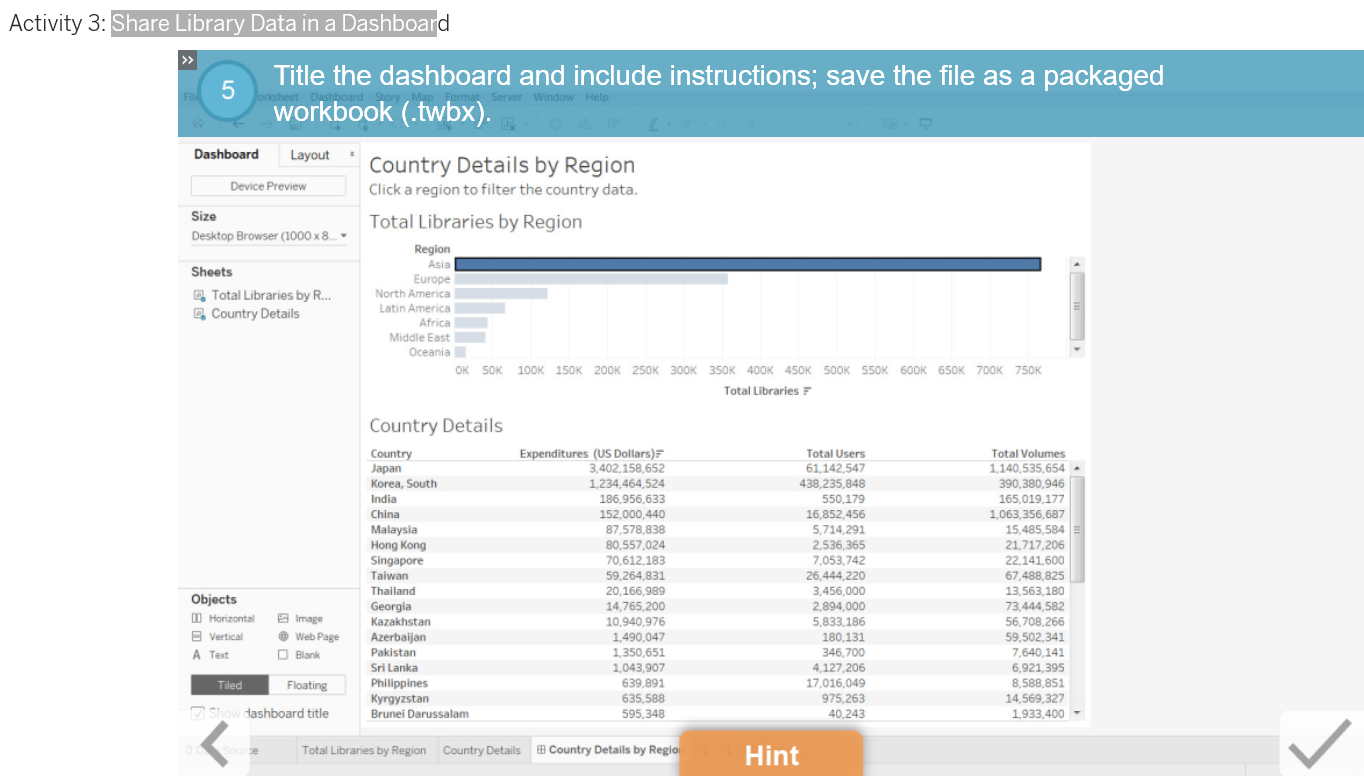
Share Library Data in a Dashboard
Lesson Objectives
At the end of this lesson, you will be able to:
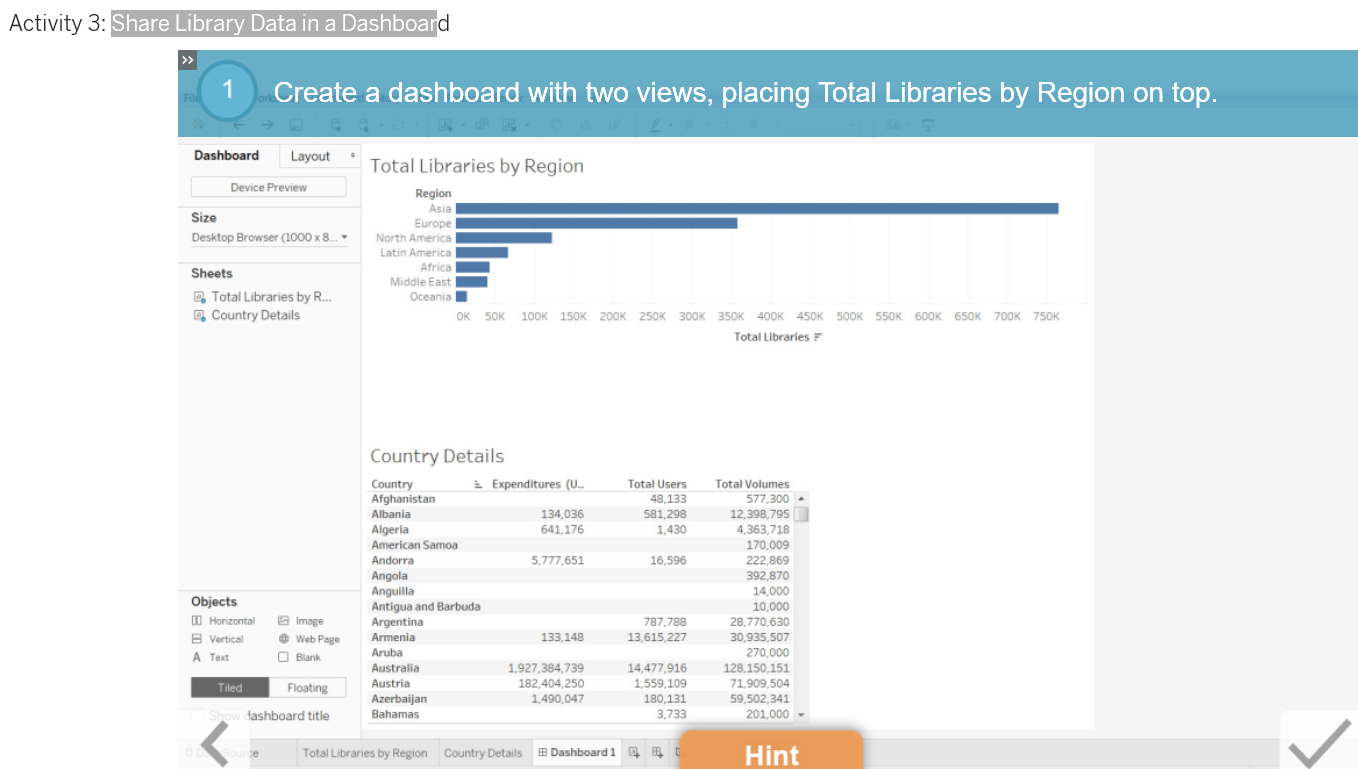
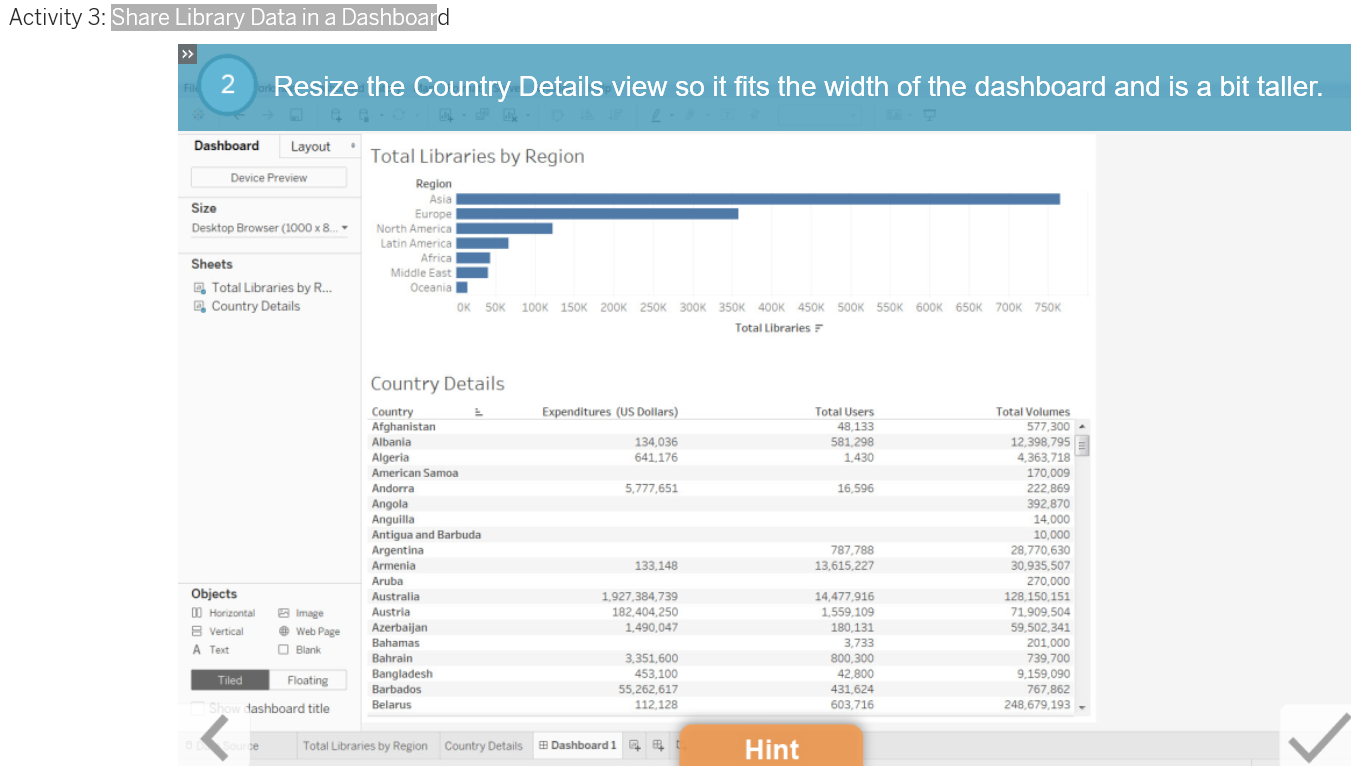
- Combine two views in a dashboard and make sizing adjustments.
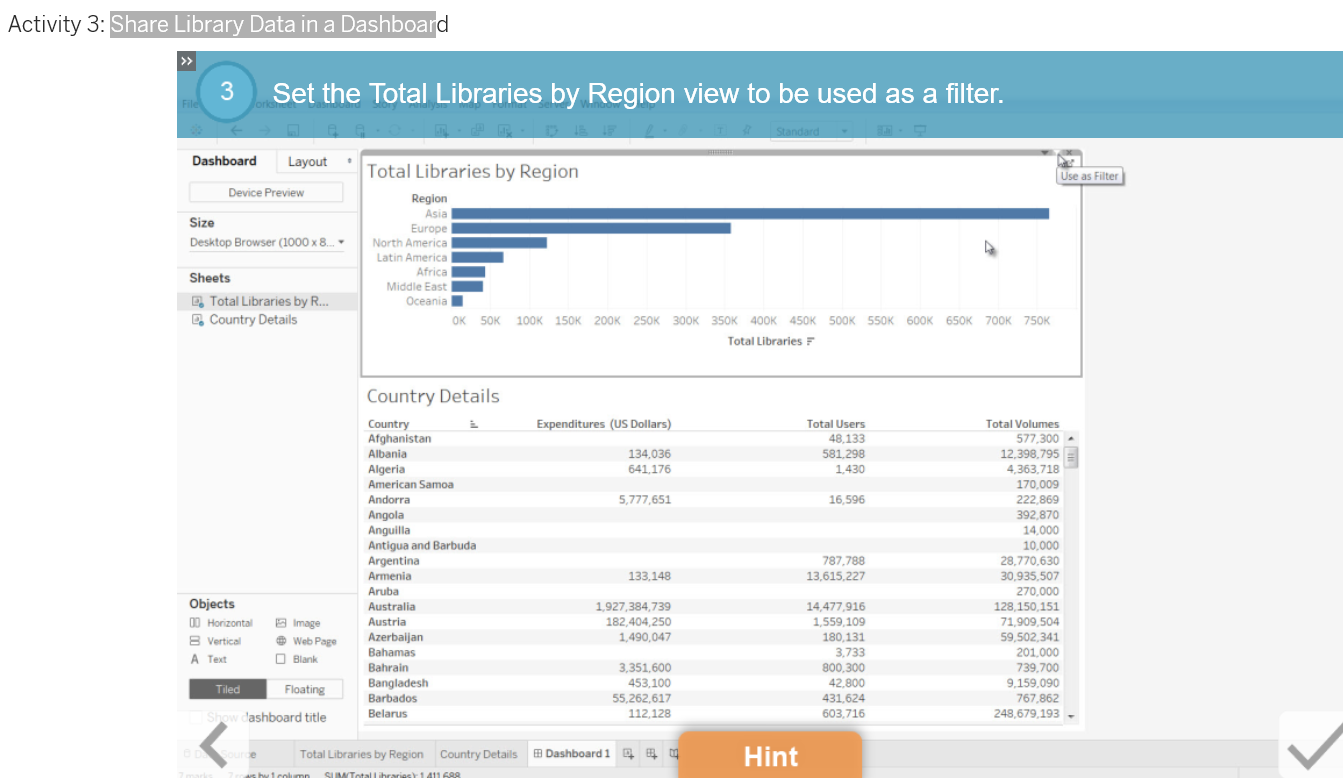
- Use one view as a filter.
- Use sorting to get highest and lowest values.
- Show and edit a dashboard title.
- Save a file as a packaged workbook (.twbx).
